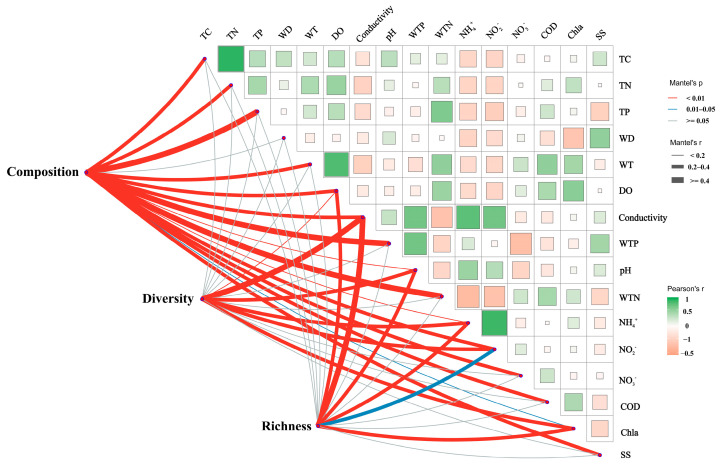
Figure 6.
Mantel analysis illustrating the relationships between sediment bacterial community composition and alpha diversity with water and sediment physicochemical properties. The pink and blue lines indicate varying levels of correlation, while the gray lines represent no correlation. The thickness of the lines corresponds to Spearman’s correlation coefficients; thicker lines indicate stronger correlations, whereas thinner lines represent weaker correlations. TC: total carbon; TN: total nitrogen; TP: total phosphorus; WT: water temperature; DO: dissolved oxygen; Conductivity: electrical conductivity; pH: pondus hydrogenii; WTP: total phosphorus in water; WTN: total nitrogen in water; NH4+: ammonia nitrogen; NO3−: nitrate nitrogen; NO2−: nitrous nitrogen; COD: chemical oxygen demand; Chla: chlorophyll a; SS: suspended solids; Diversity: sediment microbial Shannon index; Richness: sediment microbial richness; Composition: microbial Bray–Curtis dissimilarity.

