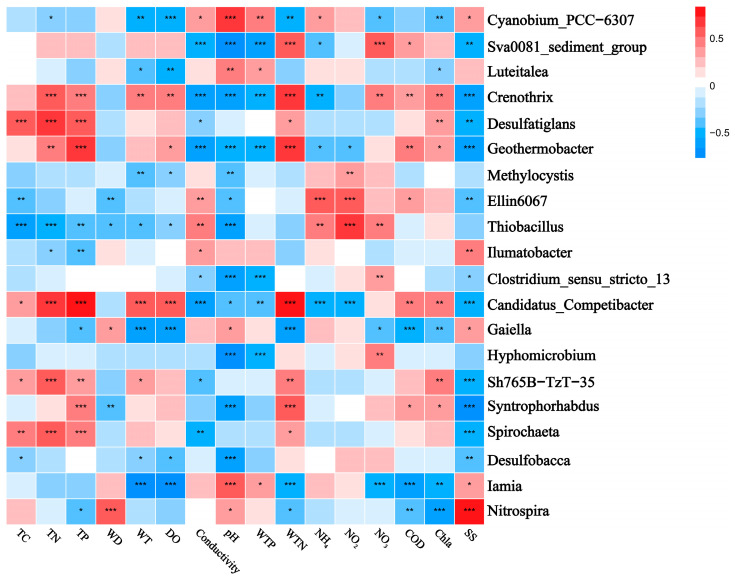
Figure 8.
Correlation heatmap showing the relationship between the top-ranked bacterial genera and water and sediment physicochemical properties across different lakes. Positive and negative correlations are indicated in red and blue, respectively (‘*’ indicates 0.01 < p ≤ 0.05; ‘**’ indicates 0.001 < p ≤ 0.01; ‘***’ indicates p ≤ 0.001). The correlations were calculated using the Pearson correlation coefficient. TC: total carbon in sediment; TN: total nitrogen in sediment; TP: total phosphorus in sediment; WT: water temperature; DO: dissolved oxygen; Conductivity: electrical conductivity; pH: pondus hydrogen; WTP: total phosphorus in water; WTN: total nitrogen in water; NH4+: ammonia nitrogen; NO3−: nitrate nitrogen; NO2−: nitrous nitrogen; COD: chemical oxygen demand; Chla: chlorophyll a; SS: suspended solids.

