Figure 3.
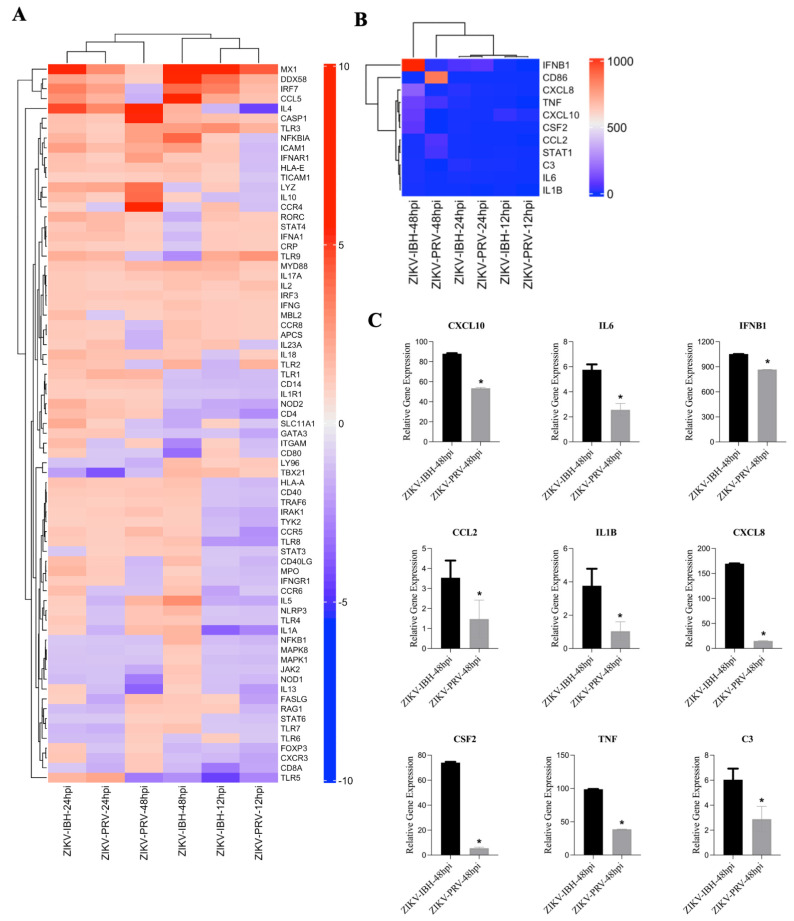
ZIKV lineages display a differential innate immunity gene expression profile upon infection. (A,B) Analysis of integrated gene expression generated by RT2 PCR Array profiler assay. Gene expression data were analyzed and determined using hierarchical cluster analysis. Columns and rows represent sample names and each gene, respectively. Each cell in the matrix represents the expression level of a gene feature in groups. The color scale bar (blue, green, and yellow) indicates increasing expression levels (low, medium, and high). Close clustering of expression data was observed between the lineages over the trajectory of 48 h of infection for those genes associated with antiviral and PRR responses. However, 48 h post–infection antiviral and inflammatory immune responses (C) were significantly elevated with ZIKV-IBH infection compared with ZIKV–PRV. An asterisk denotes significance (*), determined by an unpaired t-test (p ≤ 0.05). The error bars represent the standard deviation, n = 3.

