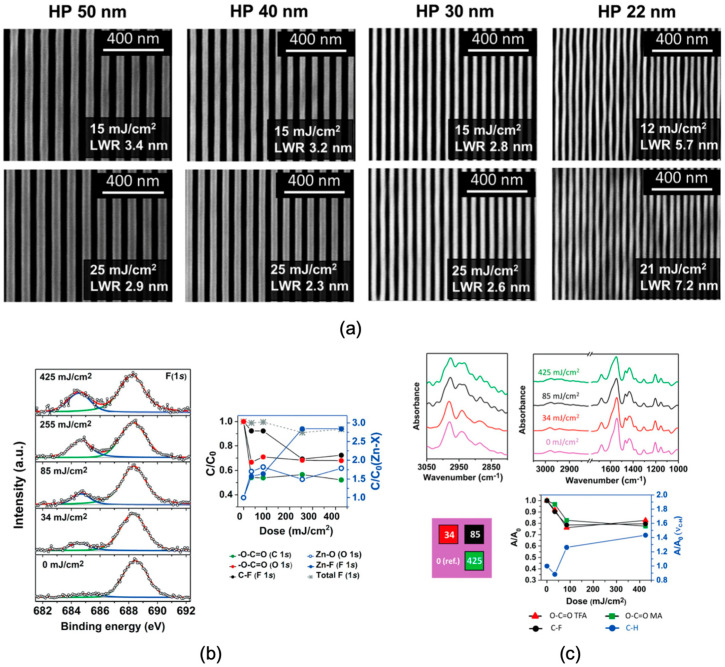
Figure 12.
(a) LWR results were determined using power spectral density (PSD) analysis of SEM images (taken at 2 kV) of the line and space features. (b) The experimental data were fitted to F 1s high-resolution spectra for both unexposed and EUV-exposed resists, revealing variations in elemental ratios of specific components relative to based on EUV dose. (c) FTIR spectra of resist films were analyzed before and after EUV exposure, including a schematic of the exposed sample showing regions subjected to different EUV doses and the changes in peak areas related to MA and TFA ligands as a function of dose compared to the unexposed region [59].

