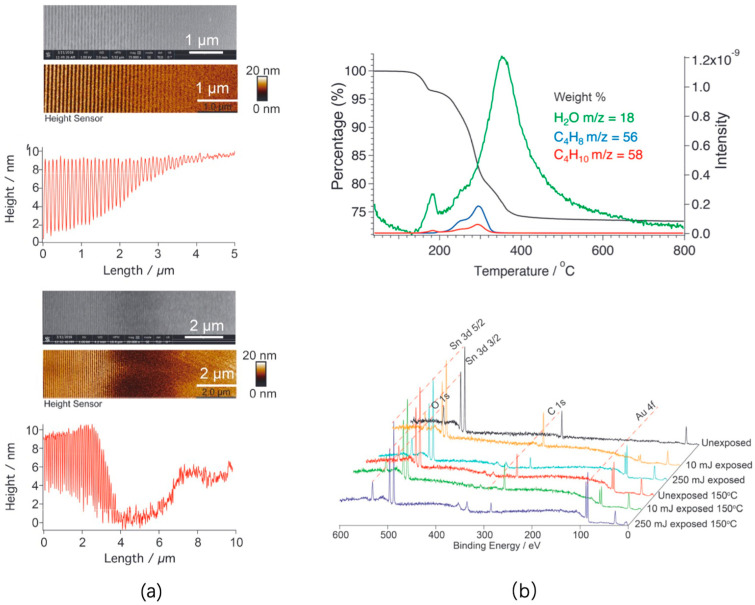
Figure 13.
(a) SEM and AFM images of tin oxo cage thin films patterned with 3.6 mJ/cm2 and 53.5 mJ/cm2 EUV doses, along with their corresponding cross-sectional profiles. (b) The spectra of thin layers with various EUV exposures and post-exposure baking, TGA of powder, highlighting weight changes and the loss of water, butene, and butane with temperature [89].

