
Figure 1.
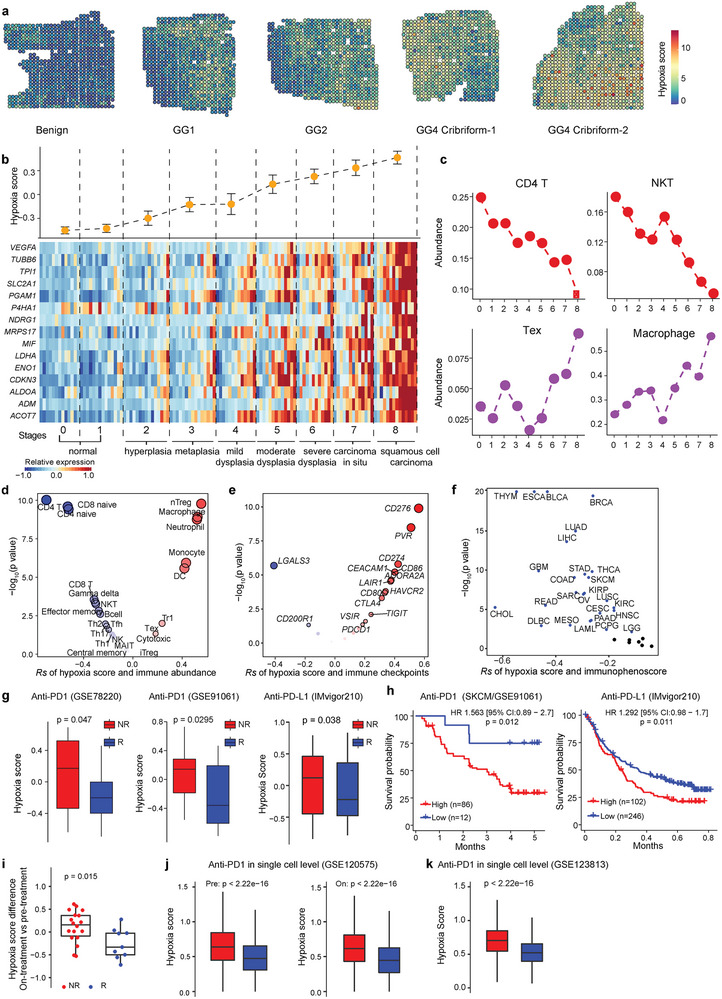
Dynamics of hypoxia and immune microenvironment during tumorigenesis and immunotherapy. a) Spatial feature plots show hypoxia status at different stages of prostate cancer in spatial transcription data (n = 10,5 × 5 mm). The samples with Benign annotation were totally histologically graded as benign, while samples annotated as GG1, GG2, GG4 Cribriform were consistent with malignant cells and partial benign cells. b) Continuous shift in hypoxia score (upper panel) during lung carcinogenesis. Results are displayed as mean ± s.d. Heat maps (bottom panel) show the expression level of 15 genes of hypoxia signature for each stage. c) The estimation of immune‐cell abundance of CD4 T, NKT, Tex, and macrophages, shows the evolving immune contexture for each developmental stage. Abbreviations: GG: Grade Group; NKT, natural killer T cells; nTreg, natural regulatory T cells; Tr1: type 1 regulatory cells; Tex: exhausted T cells. d) Spearman's correlation of hypoxia score with the abundance of 24 immune cell types (including 18 T‐cell subsets, 6 other important immune cells) from transcriptome data. Black circle indicates p < 0.05. e) Spearman's correlation between hypoxia score and the mRNA expression of 20 inhibitory immune checkpoints. Black circle indicates p < 0.05. f) Spearman's correlation of hypoxia score and immunophenoscore. Blue dots indicate p < 0.05. g) Hypoxia score difference between responders and non‐responders with treatment of PD‐1 or PD‐L1 inhibitors in three independent datasets, GSE78220, GSE91061, and IMvigor210 cohorts. h) Kaplan–Meier curves showing patients with higher hypoxia score are associated with worse overall survival in GSE91061 and IMvigor210 cohorts. n; number of patients. i) Alteration in hypoxia score between on‐treatment and pre‐treatment samples in responders and non‐responders. j,k) Hypoxia score difference between all cells of responders and non‐responders with PD‐1 inhibitors both in pre‐treatment and on‐treatment in single‐cell transcriptomics, including GSE120575 and GSE123813. A two‐sided log‐rank test was used to assess statistical significance in (h). An unpaired two‐sided Wilcoxon signed‐rank test was performed in (g, and i–k).