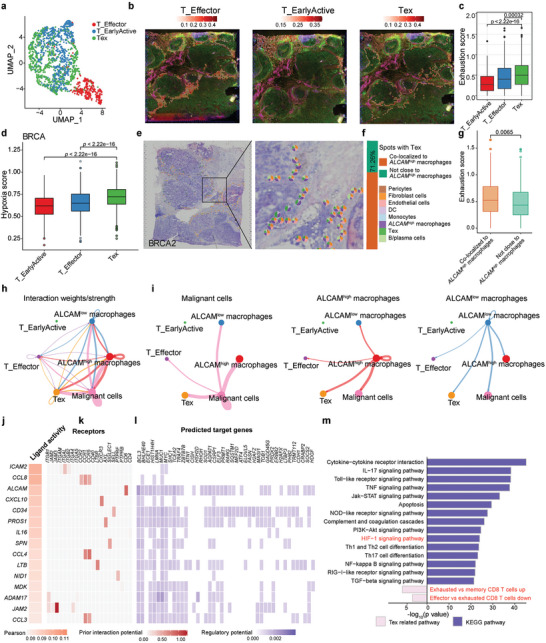
Figure 5.

ALCAM high macrophage crosstalk with exhausted CD8 T cells in tumor spatial microenvironment, a) The characteristics of T cell subtypes in the ST dataset. The UMAP projections of subtypes of myeloid cells in BRCA, including T_Effector, T_EarlyActive, and Tex (exhausted CD8 T cells). b) Predicted proportion within each capture spot for T_Effector, T_EarlyActive, and Tex in BRCA. c,d) The exhaustion score (c) and hypoxia score (d) among T_Effector, T_EarlyActive, and Tex. e–g) Spatial scatter pie plots (e) showing the proportions of the eight cell types for spots with co‐localization of ALCAM high macrophages and Tex; and bar plots (f) showing proportion of Tex spots colocalized with or without ALCAM high macrophages. (g) Box plots showing the exhaustion score between Tex spots colocalized with or without ALCAM high macrophages. h,i) Circle plot visualizing the cellular communication of cell types among malignant cells, ALCAM high macrophages, ALCAM low macrophages, T_Effector, T_EarlyActive, and Tex cells. Circle sizes are proportional to the number of cells in each cell group, and thickness of the flow represents the interaction weight. j) Top‐ranked ligands inferred to regulate exhausted CD8 + T cells by ALCAM high macrophages by NicheNet. k) Ligand‐receptor pairs showing interaction between ALCAM high macrophages and exhausted CD8 + T cells ordered by ligand activity (j). l) Heatmap showing regulatory potential of top 15 ranked ligands (j) and the downstream target genes in exhausted CD8 + T cells. m) Representative KEGG pathways and related exhausted pathway enrichment of the predicted target genes expressed in exhausted CD8 + T cells. The boxes in (c,d,g) show the median ±1 quartile, with the whiskers extending from the hinge to the smallest or largest value within 1.5× the IQR from the box boundaries. A two‐sided Wilcoxon signed‐rank test was used to assess statistical significance in (c,d,g), Fisher's test in (m).
