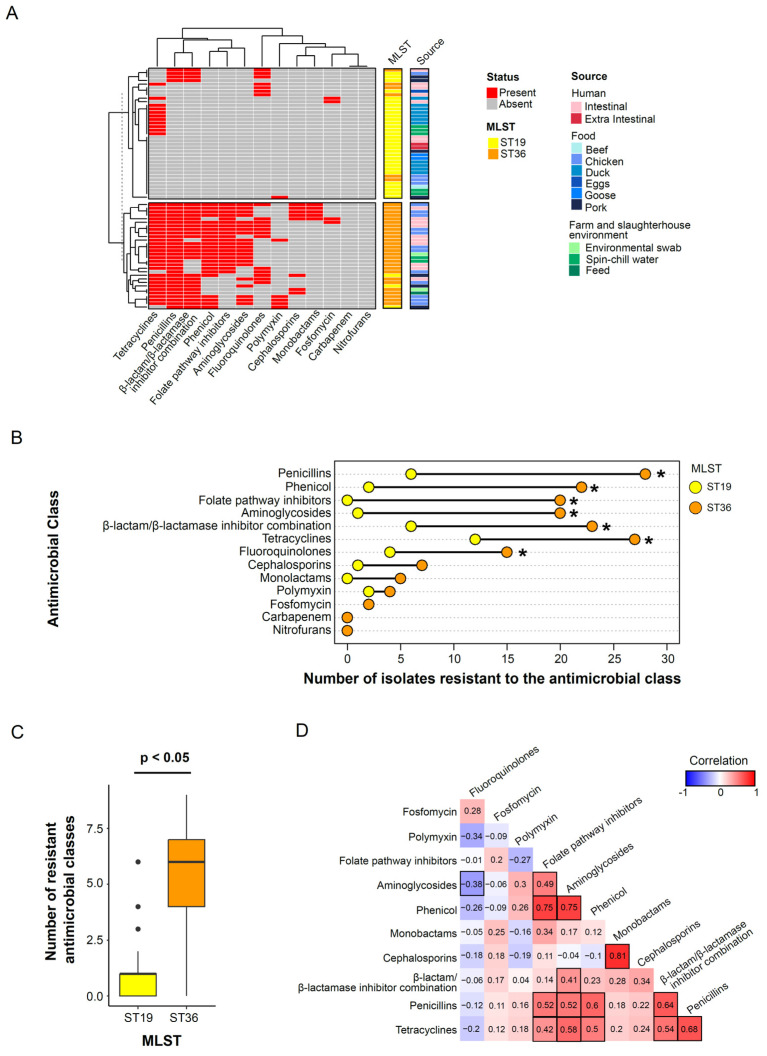
Figure 3.
Phenotypic antimicrobial resistance profiling. (A) Clustering profile of phenotypic antimicrobial resistance in S. Typhimurium isolates. (B) Phenotypic antimicrobial resistance in ST19 and ST36 isolates. * Denotes adjusted p-value < 0.05, Chi-square test. (C) Distribution of the number of resistant antimicrobial classes in ST19 and ST36 isolates. Mann–Whitney U-test p-value < 0.05. (D) Correlations of phenotypic antimicrobial resistance classes in ST36 isolates. Correlations with p-value < 0.05 have been bordered in black.

