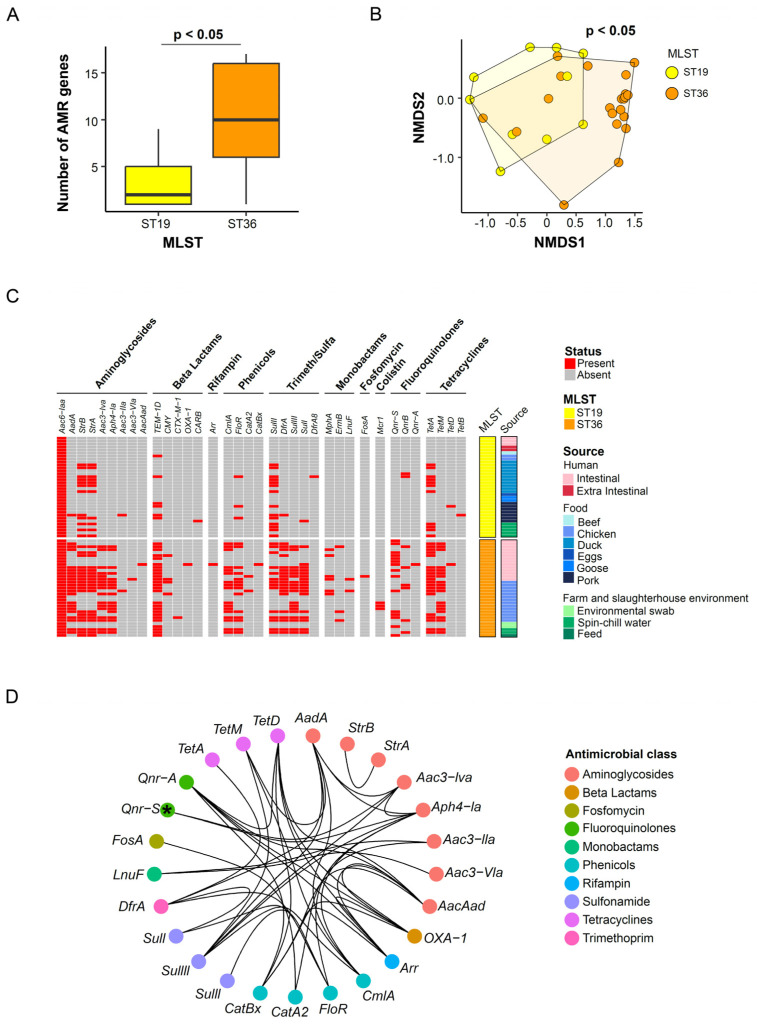
Figure 4.
Phenotypic antimicrobial resistance profiling. (A) Distribution of the number of detected antimicrobial genes in ST19 and ST36 isolates. * Denotes adjusted p-value < 0.05, Mann–Whitney U-test. (B) Non-metric multidimensional scaling (NMDS) was performed with the presence and absence status of the antimicrobial genes from all 67 S. Typhimurium isolates. Each isolate is represented by a point and colored according to its sequence type. (C) Clustering profile of genotypic antimicrobial resistance in S. Typhimurium isolates. (D) Correlation networks of the antimicrobial genes were constructed using the presence and absence status of the antimicrobial genes from all 67 S. Typhimurium isolates. Each node represents a gene and is colored according to its corresponding antimicrobial class. The edges represent the correlation coefficient and are colored based on the strength of the correlation. * Denotes a negative correlation coefficient.

