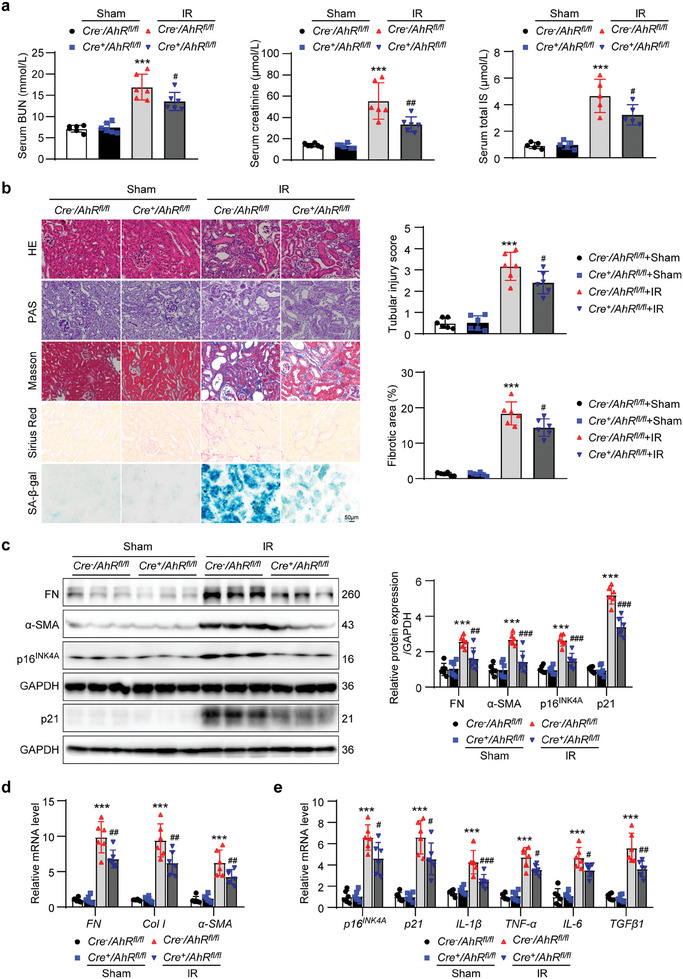
Figure 2.

Renal tubular epithelial cell‐specific knockout of AhR mitigated the decline in renal function, senescence and fibrosis in IR mice. a) Serum BUN, creatinine and IS concentrations in mice from different groups. *** P < 0.001 versus Cre−AhRfl/fl +sham group, # P < 0.05, ## P < 0.01 versus Cre−AhRfl/fl +IR group (n = 5 or 6). b) HE, PAS, Masson, Sirius red and SA‐β‐gal staining micrographs of kidneys in mice from different groups. Scale bar, 50 µm. Evaluation of tubular injury score based on HE staining. Fibrotic area evaluation based on Masson staining. *** P < 0.001 versus Cre−AhRfl/fl +sham group, # P < 0.05 versus Cre−AhRfl/fl +IR group (n = 6). c) Western blot images and quantitative analysis of fibrosis markers FN and α‐SMA, and senescence markers p16INK4A and p21 in kidneys from different groups of mice. *** P < 0.001 versus Cre−AhRfl/fl +sham group, ## P < 0.01, ### P < 0.001 versus Cre−AhRfl/fl +IR group (n = 6). d) The relative mRNA abundance of fibrosis markers FN, Col I, and α‐SMA in kidneys from different groups of mice. *** P < 0.001 versus Cre−AhRfl/fl +sham group, ## P < 0.01 versus Cre−AhRfl/fl +IR group (n = 6). e) The relative mRNA abundance of senescence markers p16INK4A , p21, and secretory factors IL‐1β, TNF‐α, IL‐6, and TGFβ1 in kidneys from different groups of mice. *** P < 0.001 versus Cre−AhRfl/fl +sham group, # P < 0.05, ## P < 0.01, ### P < 0.001 versus Cre−AhRfl/fl +IR group (n = 6). Data were shown as mean ± SD. Statistical analysis was performed by two‐way ANOVA with Tukey's multiple comparisons test (a‐e).
