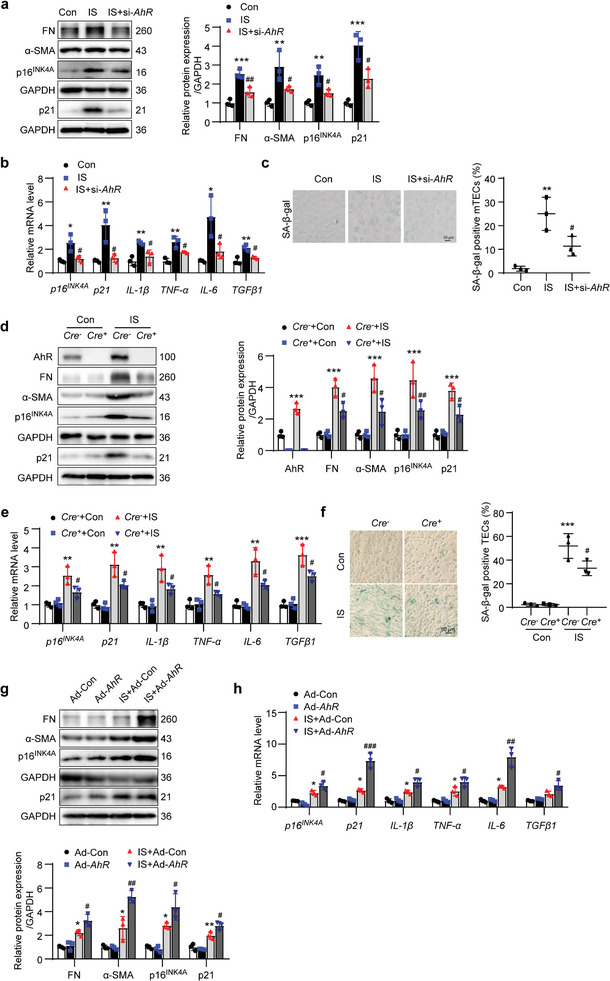
Figure 4.

AhR promoted IS‐induced cell senescence and ECM production in mTECs or primary TECs. The mTECs were transfected with AhR siRNA (si‐AhR) for 12 h and then treated with IS (1000 µmol L−1) for an additional 36 h. a) Western blot images and quantitative data of FN, α‐SMA, p16INK4A, and p21 in mTECs. ** P < 0.01, *** P < 0.001 versus Con group, # P < 0.05, ## P < 0.01 versus IS group (n = 3). b) The relative mRNA abundance of p16INK4A , p21, IL‐1β, TNF‐α, IL‐6, and TGFβ1 in mTECs. * P < 0.05, ** P < 0.01 versus Con group, # P < 0.05 versus IS group (n = 3). c) The SA‐β‐gal staining micrographs and quantitative data showing mTEC senescence. Scale bar, 50 µm. ** P < 0.01 versus Con group, # P < 0.05 versus IS group (n = 3). Primary TECs isolated from Cre−AhRfl/fl mice (Cre− ) or Cre+AhRfl/fl mice (Cre+ ) were treated with IS (1000 µmol L−1) for 36 h. d) Western blot images and quantitative data of AhR, FN, α‐SMA, p16INK4A, and p21 in primary TECs. *** P < 0.001 versus Cre− +Con group, # P < 0.05, ## P < 0.01 versus Cre− +IS group (n = 3). e) The relative mRNA abundance of p16INK4A , p21, IL‐1β, TNF‐α, IL‐6, and TGFβ1 in primary TECs. ** P < 0.01, *** P < 0.001 versus Cre− +Con group, # P < 0.05 versus Cre− +IS group (n = 3). f) The SA‐β‐gal staining micrographs and quantitative data showing TEC senescence. Scale bar, 50 µm. *** P < 0.001 versus Cre− +Con group, # P < 0.05 versus Cre− +IS group (n = 3). The mTECs were treated with IS (1000 µmol L−1) or adenovirus harboring AhR gene (Ad‐AhR) for 36 h. g) Western blot images and quantitative analysis of FN, α‐SMA, p16INK4A, and p21 expressions in mTECs. * P < 0.05, ** P < 0.01 versus Ad‐Con group, # P < 0.05, ## P < 0.01 versus IS+Ad‐Con group (n = 3). h) The relative mRNA abundance of cell senescence markers p16INK4A and p21 as well as secretory factors IL‐1β, TNF‐α, IL‐6, and TGFβ1 in mTECs. * P < 0.05 versus Ad‐Con group, # P < 0.05, ## P < 0.01, ### P < 0.001 versus IS+Ad‐Con group (n = 3). Data were shown as mean ± SD. Statistical analysis was performed by one‐way ANOVA with Tukey's multiple comparisons test (a‐c) and two‐way ANOVA with Tukey's multiple comparisons test (d‐h).
