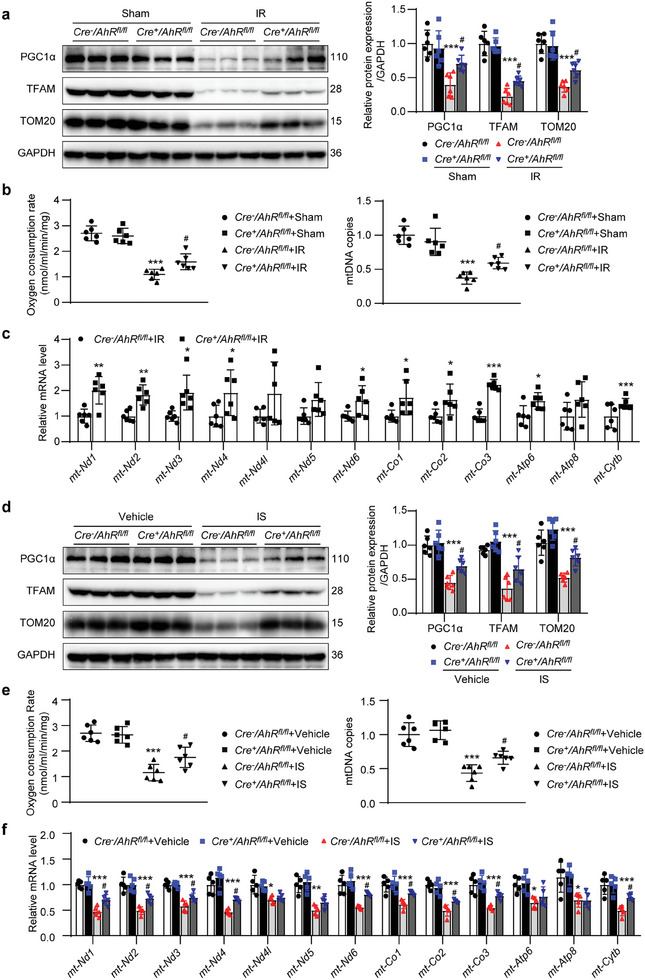
Figure 5.

Renal tubular epithelial cell knockout of AhR blunted the suppression of mitochondrial biogenesis in the kidneys of IR‐ or IS‐treated mice. a) Western blot images and quantitative data of the protein levels of PGC1α, TFAM, and TOM20 in the kidneys of mice with or without IR surgery. *** P < 0.001 versus Cre−AhRfl/fl +sham group, # P < 0.05 versus Cre−AhRfl/fl +IR group (n = 6). b) The renal oxygen consumption rate (OCR) and mitochondrial DNA (mtDNA) copies of mice with or without IR surgery. *** P < 0.001 versus Cre−AhRfl/fl +sham group, # P < 0.05 versus Cre−AhRfl/fl +IR group (n = 6). c) qPCR showing the mRNA levels of 13 mtDNA in the kidneys of mice with or without IR surgery. * P < 0.05, ** P < 0.01, *** P < 0.001 versus Cre−AhRfl/fl +IR group (n = 6). d) Western blot images and quantitative data of the protein levels of PGC1α, TFAM and TOM20 in the kidneys of mice with or without IS treatment. *** P < 0.001 versus Cre−AhRfl/fl +vehicle group, # P < 0.05 versus Cre−AhRfl/fl +IS group (n = 6). e) Renal OCR and mtDNA of mice with or without IS treatment. *** P < 0.001 versus Cre−AhRfl/fl +vehicle group, # P < 0.05 versus Cre−AhRfl/fl +IS group (n = 6). f) qPCR showing the mRNA levels of 13 mtDNA in the kidneys of mice with or without IS treatment. * P < 0.05, ** P < 0.01, *** P < 0.001 versus Cre−AhRfl/fl +vehicle group, # P < 0.05 versus Cre−AhRfl/fl +IS group (n = 5). Data were shown as mean ± SD. Statistical analysis was performed by two‐tailed unpaired Student's t‐test (mt‐Nd1, mt‐Nd2, mt‐Nd4, mt‐Nd5, mt‐Co2, mt‐Co3, Atp6, Atp8, mt‐Cytb of c), two‐tailed unpaired Welch’ t‐test (mt‐Nd3, mt‐Nd4l, mt‐Nd6, mt‐Co1 of c), and two‐way ANOVA with Tukey's multiple comparisons test (a, b, d, e, f).
