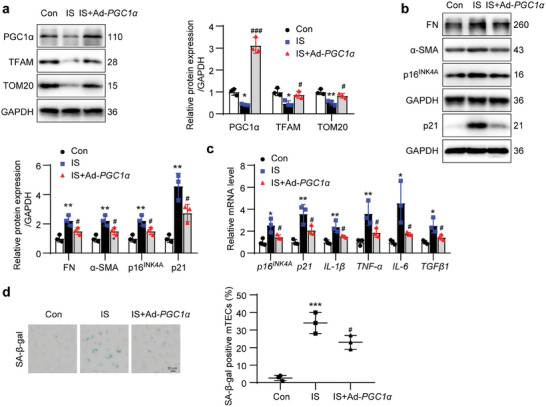
Figure 7.

Overexpression of PGC1α alleviated IS‐induced cell senescence and ECM production. The mTECs were treated with IS (1000 µmol L−1) or adenovirus harboring PGC1α gene (Ad‐PGC1α) for 36 h. a) Western blot images and quantitative analysis showing the expressions of PGC1α, TFAM and TOM20 in mTECs. * P < 0.05, ** P < 0.01 versus Con group, # P < 0.05, ### P < 0.001 versus IS group (n = 3). b) Western blot images and quantitative analysis showing the expressions of FN, α‐SMA, p16INK4A and p21 in mTECs. ** P < 0.01 versus Con group, # P < 0.05 versus IS group (n = 3). c) qPCR analysis of the relative mRNA levels of p16INK4A , p21, IL‐1β, TNF‐α, IL‐6, and TGFβ1 in mTECs. * P < 0.05, ** P < 0.01 versus Con group, # P < 0.05 versus IS group (n = 3). d) The SA‐β‐gal staining micrographs and quantitative analysis showing the mTEC senescence. Scale bar, 50 µm. *** P < 0.001 versus Con group, # P < 0.05 versus IS group (n = 3). Data were shown as mean ± SD. Statistical analysis was performed by one‐way ANOVA with Tukey's multiple comparisons test (a‐d).
