Figure 5.

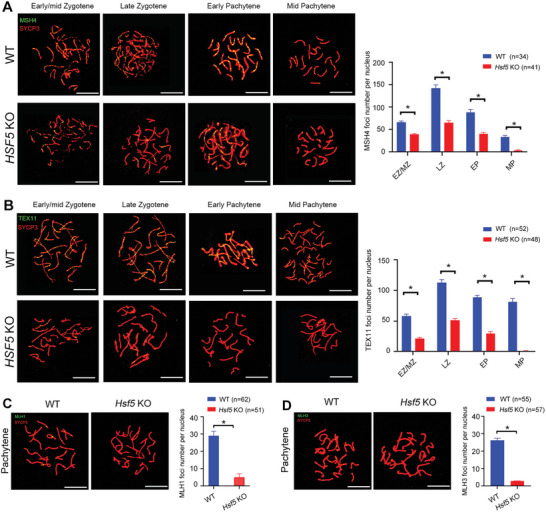
HSF5 is related to crossover formation and late recombination during meiosis. A) Immunofluorescence staining of MSH4 and SYCP3 in spread spermatocytes at successive prophase stages from 8‐week‐old WT and Hsf5 KO mice, including early/mid‐zygotene, late zygotene, early pachytene and mid‐pachytene stages. The number of MSH4 foci decreased in Hsf5 KO spermatocytes compared to WT spermatocytes in these stages. Quantification of MSH4 foci per nucleus at the indicated substages (N = 3 biologically independent WT mice and KO mice; n, the total number of nuclei analyzed; two‐sided Student's t test; *P < 0.05; error bars, mean ± SEM; green, MSH4; red, SYCP3; scale bars, 10 µm). B) Immunofluorescence staining showing the expression of TEX11 and SYCP3 in spread spermatocytes at successive prophase stages from 8‐week‐old WT and Hsf5 KO mice. TEX11 foci were more readily detected in Hsf5 KO spermatocytes than in WT spermatocytes. Quantification of TEX11 foci per nucleus at the indicated substages (N = 3 biologically independent WT mice and KO mice; n, the total number of nuclei analyzed; two‐sided Student's t test; *P < 0.05; error bars, mean ± SEM; green, TEX11; red, SYCP3; scale bars, 10 µm). C) Representative images of pachynema spermatocytes stained for MLH1 and SYCP3 from 8‐week‐old WT and Hsf5 KO mice. Almost no MLH1 signal was detected in Hsf5 KO spermatocytes compared to WT spermatocytes. Quantification of MLH1 foci per nucleus in the pachynema spermatocytes (N = 3 biologically independent WT mice and KO mice; n, the total number of nuclei analyzed; two‐sided Student's t test; *P < 0.05; error bars, mean ± SEM; green, MLH1; red, SYCP3; scale bars, 10 µm). D) Spread spermatocytes from 8‐week‐old WT and Hsf5 KO mice were stained for MLH3 and SYCP3. The numbers of MLH3 foci were sharply reduced in Hsf5 KO spermatocytes. Quantification of MLH3 foci per nucleus in the pachynema spermatocytes (N = 3 biologically independent WT mice and KO mice; n, the total number of nuclei analyzed; two‐sided Student's t test; *P < 0.05; error bars, mean ± SEM; green, MLH3; red, SYCP3; scale bars, 10 µm).
