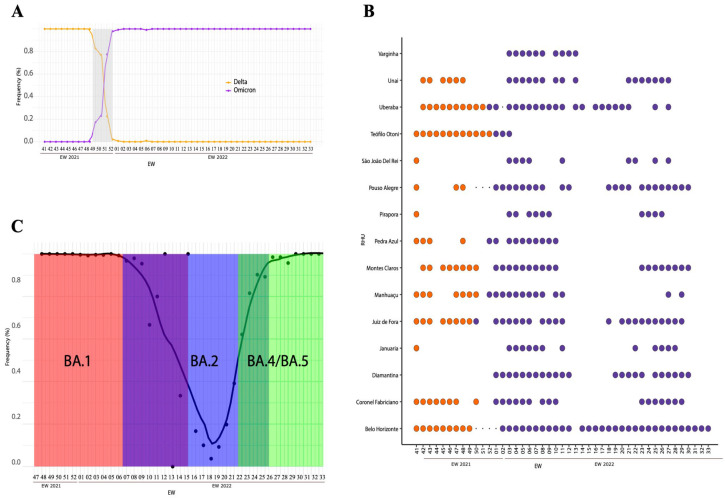
Figure 2.
Distribution of SARS-CoV-2 lineages in MG. (A) Replacement of Delta to Omicron in MG state. The color orange represents Delta, while purple represents VOC Omicron. (B) Replacement period between Delta and VOC Omicron by RHU per EW. Blank spaces indicate the absence of samples in that RHU and EW. The orange color represents the VOC Delta, while the purple represents VOC Omicron. (C) Frequency of the H69/V70 deletion present in the samples investigated throughout the study. Transition periods between the predominance of BA.1 to BA.2 and from BA.2 to BA.4/BA.5 are indicated by the overlapping colors.

