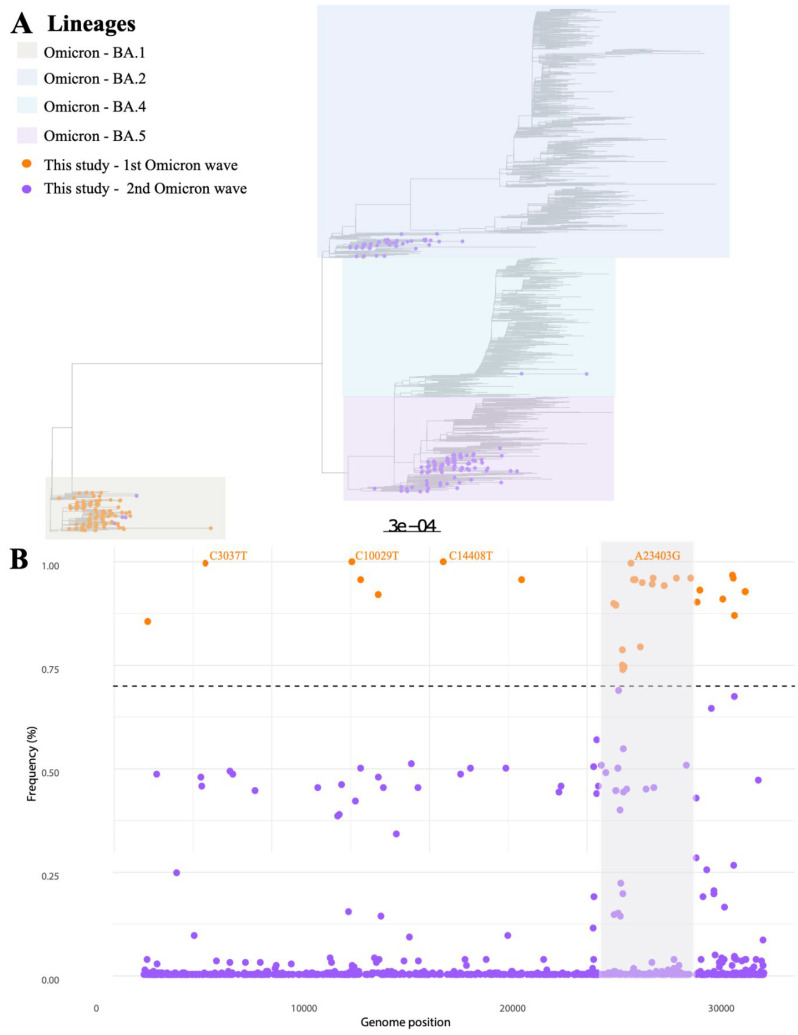
Figure 4.
Diversity of Omicron subvariants in MG state. (A) Maximum likelihood phylogeny using the VOC Omicron NextStrain Global dataset as reference. The circles represent the genomes generated in our study (n = 253) according to the Omicron wave which they were collected. Each Omicron sublineage (BA.1, BA.2. BA.4, and BA.5) is represented by a different color. (B) Synonymous mutation profile of the sequenced genomes. More than 858 mutations were identified. Orange circles represent synonymous mutations found in at least 70% of the genomes, with only four presented in all genomes (100%). The mutations are labeled next to the circles. Purple circles represent mutations found at low frequency in the genomes generated. The gray shading indicates the position of the Spike gene in the SARS-CoV-2 genome.

