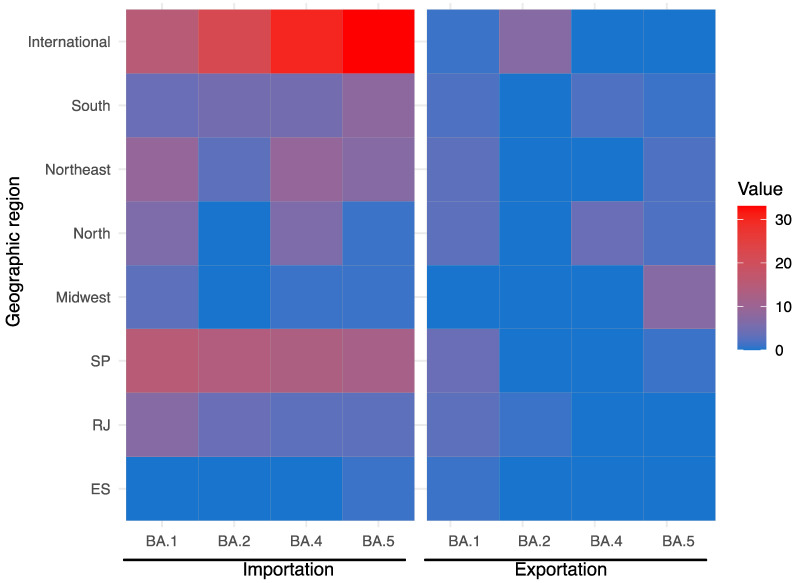
Figure 5.
Correlation plot showing the profile of importations and exportation events for each Omicron subvariants (BA.1, BA.2, BA.4, and BA.5) in the state of Minas Gerais as evaluated in our study. Blue colors represent a lower number of events, while red colors represent a higher number of events.

