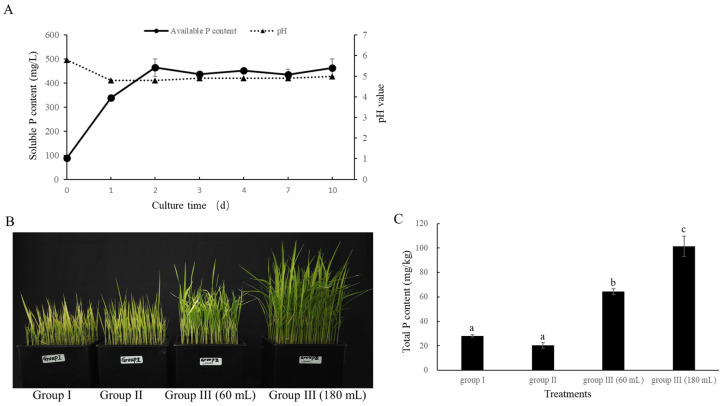
Figure 5.
Quantitative assessment of phosphate solubilization and plant growth-promoting activity of BC11-1. (A) After being exposed to BC11-1 for 0, 1, 2, 3, 4, 7, and 10 d, dynamic change in soluble phosphate content in NBRP broth media and the pH value. Data represent the mean ± SD (n = 3). Data represent the mean ± SD (n = 3). (B) Three groups of rice seedlings were subjected to different treatments (from left to right), as follows: Group I received tap water only; Group II received tap water containing 5 g/L Ca3(PO4)2; and Group III received tap water containing either 60 mL or 180 mL phosphate solution produced by BC11-1. (C) Phosphate content in plants in the three different groups. Data represent the mean ± se (n = 3). Different lowercase letters above the bars indicate significant differences in the level of phosphorus in plants in the three different groups of fungi (p < 0.05) as indicated by a Tukey’s test.

