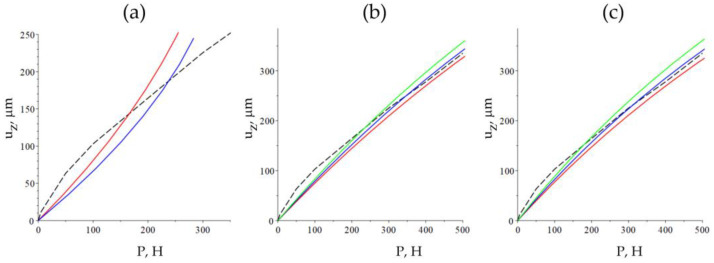
Figure 11.
Dependences of the vertical displacement of the sample (μm) on the load P (N), obtained numerically (the continuous lines) and experimentally (the dashed lines); (a): linear elasticity, E = 10 MPa (the red line—, and the blue line—), (b): hyper-elasticity, (the red line—E = 9.5 MPa, and the blue line—E = 9.0 MPa, the green line—E = 8.5 MPa), (c): hyper-elasticity, (the red line—E = 7.5 MPa, the blue line—E = 7 MPa, the green line—E = 6.5 MPa).

