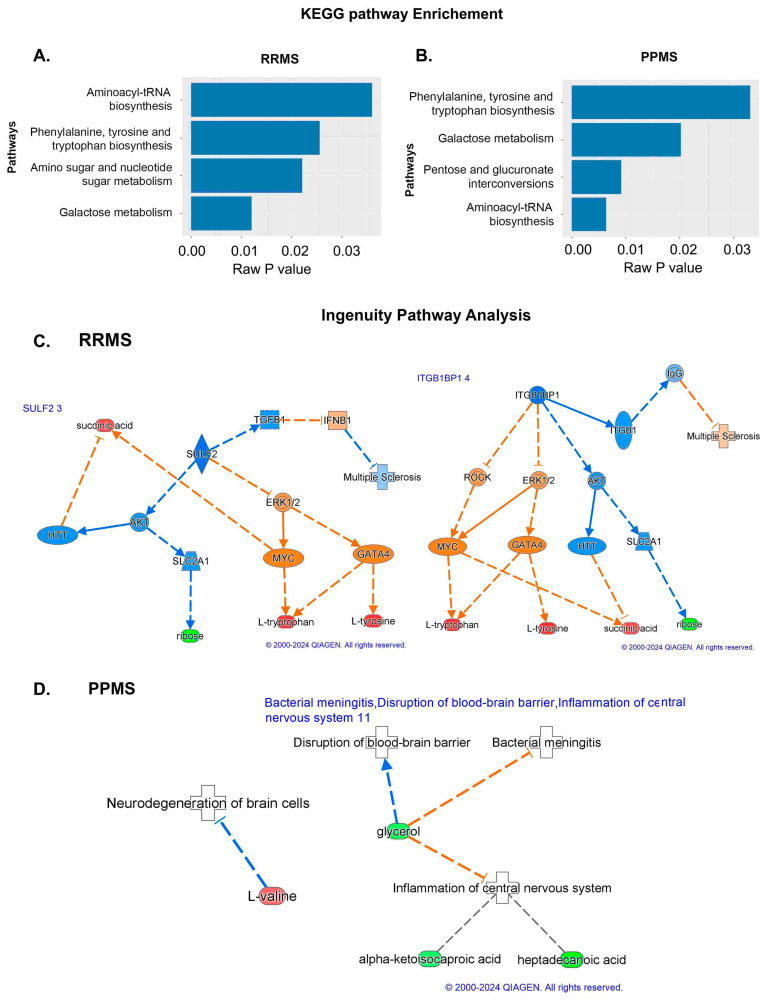
Figure 3.
Pathway analysis using KEGG and IPA. (A,B) KEGG pathway analysis in which the pathways and raw p-values are shown for the RRMS and PPMS patients. (C,D) IPA of the molecules SULF2 3 and ITGB1BP1 8 in RRMS and PPMS. Associations of differentially expressed metabolites between RRMS and HS with biological processes and upstream regulators determined via IPA. In addition, SULF2 and ITGB1BP1, which are the primary regulators activated for activation based on the different levels of metabolites in the chain below, exhibited connectivity. The prediction of activation is shown by the broken orange lines, whereas the prediction inhibition is represented by the broken blue line. The red color shows the upregulation of RRMS. The last layer shows the different metabolites in RRMS and HS (The networks were generated through the use of IPA (QIAGEN Inc., https://digitalinsights.qiagen.com/products-overview/discovery-insights-portfolio/analysis-and-visualization/qiagen-ipa/?cmpid=PromoTile_Discovery_2B3_WP, accessed on 12 July 2024)).

