. 2024 Sep 27;13:RP97604. doi: 10.7554/eLife.97604

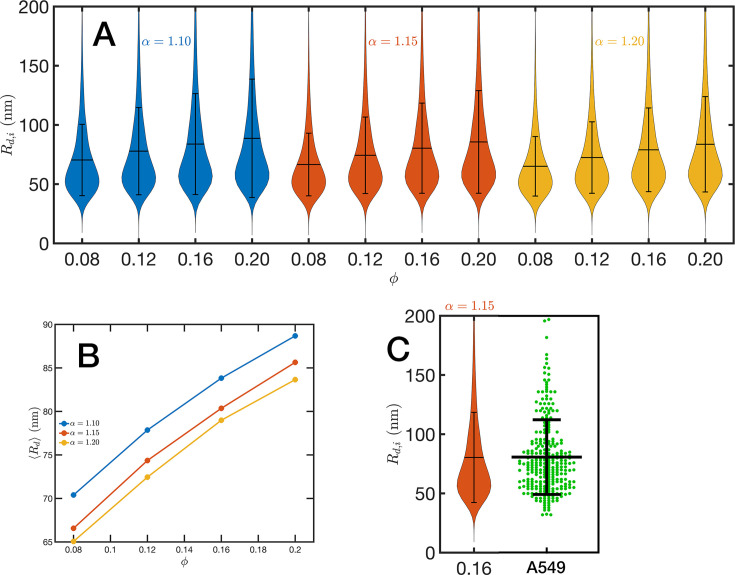
Figure 7. Chromatin packing domains.

(A) Distributions of domain radii Rd,i for all combinations of Self Returning Excluded Volume (SR-EV) parameters α and ϕ, as labeled in the figure. (B) Mean value Rd of the domain radii distributions. (C) In green, experimental distribution of domain radii obtained with chromatin scanning transmission electron microscopy (ChromSTEM) on A549 cell line, and the closest approximation from SR-EV that corresponds to α=1.15 and ϕ=0.16.

Figure 7.

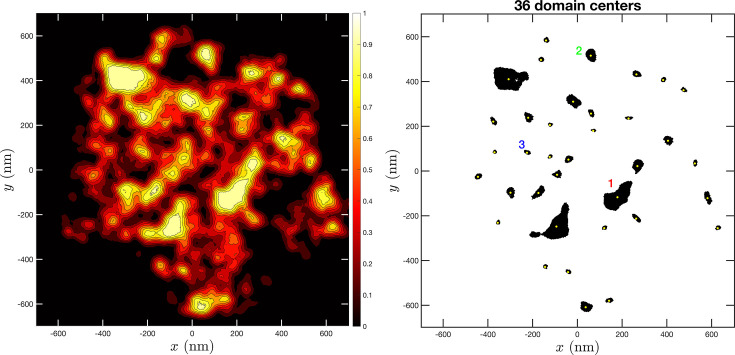
Figure 7—figure supplement 1. Example of domain and domain’s center determination from Self Returning Excluded Volume (SR-EV) slabs.

Figure 7—figure supplement 1.

The left image shows the collapse SR-EV density from a 100-nm slab. The right image shows the identified domains cores in black and their geometric centers in yellow. Three different domains are identified with the numbers.
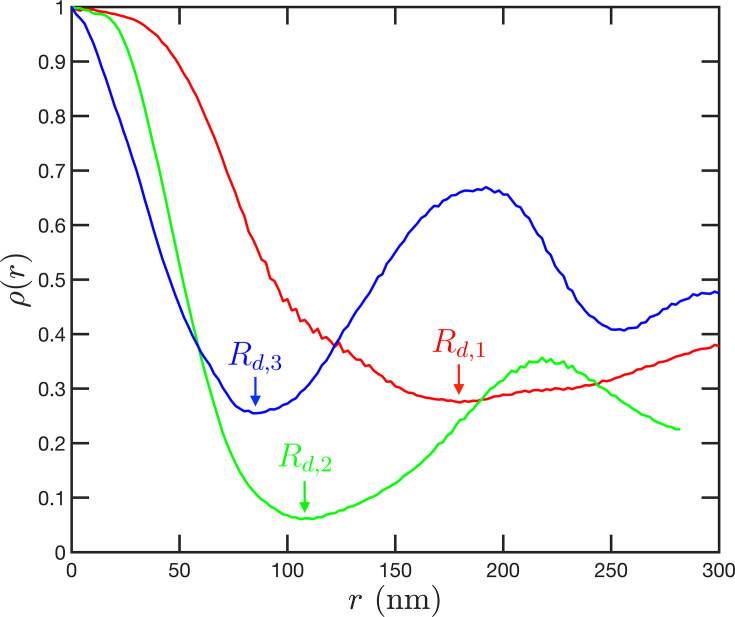
Figure 7—figure supplement 2. Example of the determination of the density profiles of domains and their effective radii.

Figure 7—figure supplement 2.

The three cases correspond to the large, medium, and small domains denoted by 1, 2, and 3 in Figure 7—figure supplement 1. The profiles are calculated from the domain center using the coordinates from the configurations and assuming cylindrical symmetry. The radius of a domain corresponds to the first minimum in the density profile.