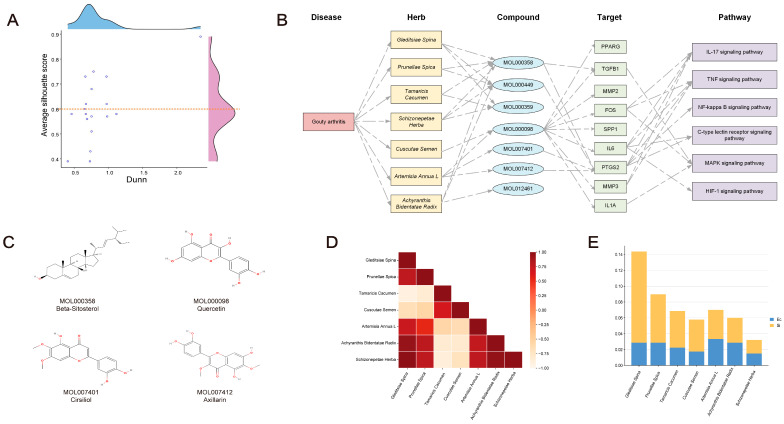
Figure 7.
Building a network of disease–TCM compound–target signaling pathways through collaborative association. The following examples show the relationship between the Dunn and average silhouette scores of Chinese herbal medicines: (A) Scatter plot. (B) Building multi-layer networks. (C) High-frequency compounds and recently identified targeted compounds. (D) Heatmap of each Chinese herbal medicine’s correlation coefficient. (E) Histogram of each Chinese herbal medicine’s Ec and Si in GAD.

