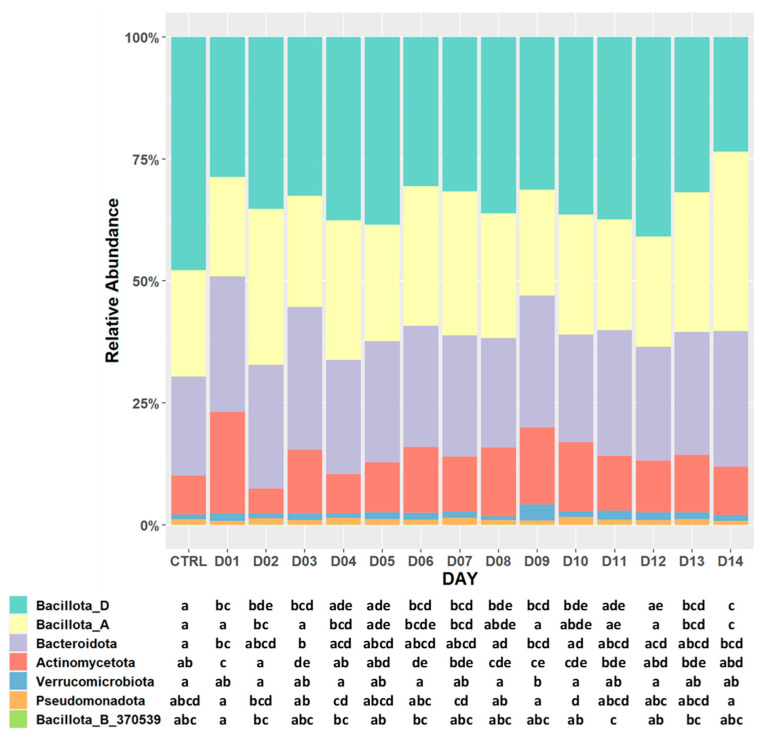
Figure 4.
Bar plot of relative abundances of observed bacterial differences at the phylum level in pulse-containing and pulse-free control diets. The letters in the plot represent pairwise statistical comparisons using the Dunn test: matching letters within a particular row (phylum) among different columns (menu) denote the lack of statistical significance between the respective diet groups (q-value > 0.05).

