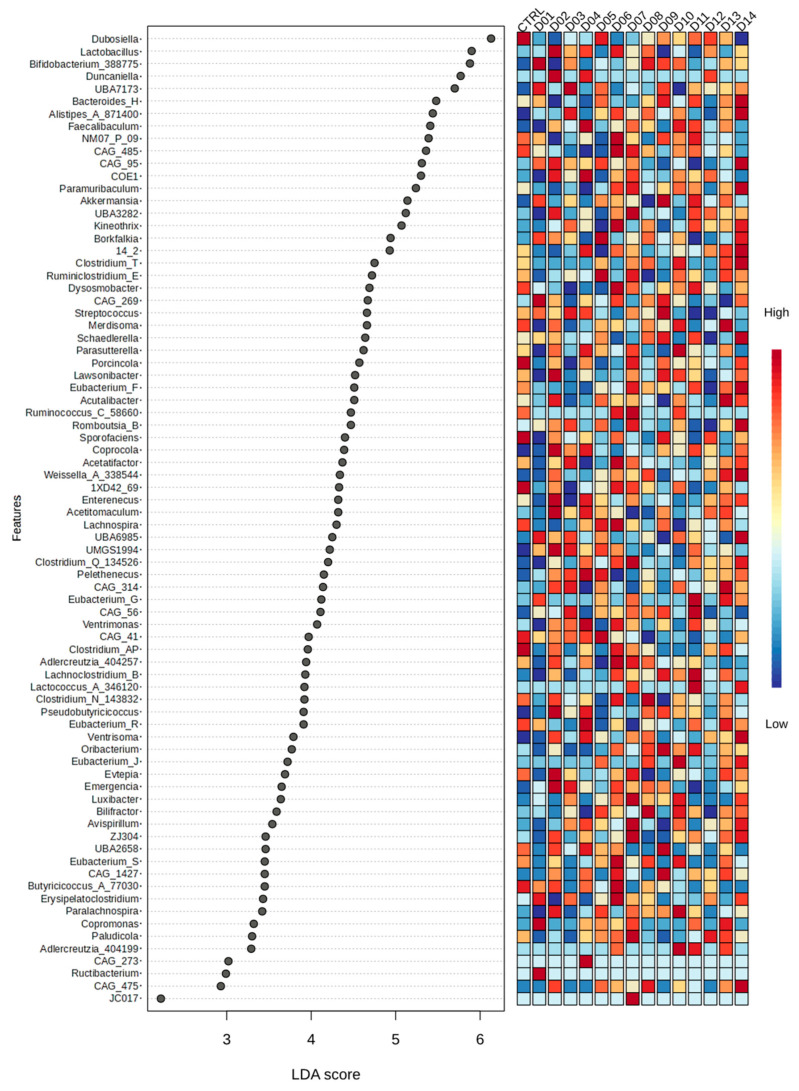
Figure 5.
Differential abundance analyses of microbial differences across pulse-free control and fourteen pulse-based menus from Bean Cuisine using LEfSe with cutoffs for |LDA score| > 2 and q-value < 0.05. The full report can be found in Supplementary Table S2.

