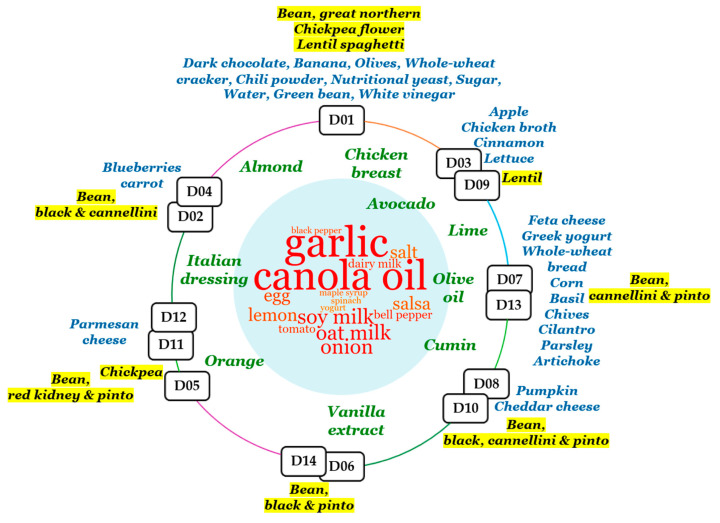
Figure 9.
Distribution of food types across the microbiome-similar menus of Bean Cuisine. Clusters of menus are depicted on the circle. Inside the circle, the word cloud represents food types that were common across multiple clusters (from red, the most common, to green, shared by only two menu clusters). Outside of the circle, foods that were classifying each menu cluster are marked in blue and located near their cluster. Pulses present within each menu cluster are similarly located and highlighted in yellow. Clusters of menus were composed based on hierarchical analysis of the microbial composition that Bean Cuisine menus induce in the ceca of mice.

