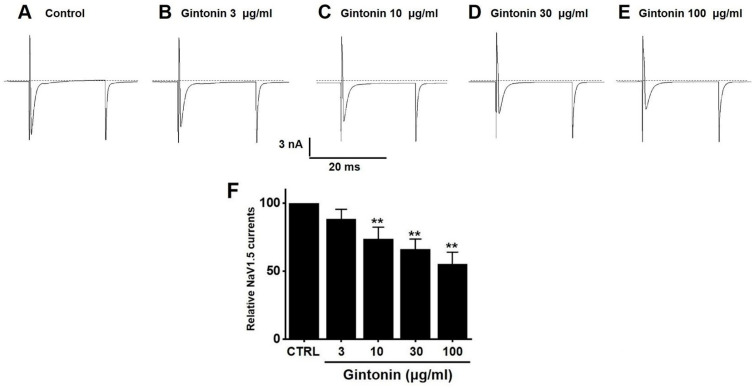
Figure 9.
Effects of gintonin on overexpressed voltage-gated sodium (NaV1.5) currents in HEK293T cells. Representative plot displaying the effects of gintonin at different concentrations, (A) control, (B) 3, (C) 10, (D) 30, and (E) 100 μg/mL, on overexpressed NaV1.5 currents. (F) Statistical analysis of relative changes of NaV1.5 currents by gintonin. ** p < 0.01 vs. control.

