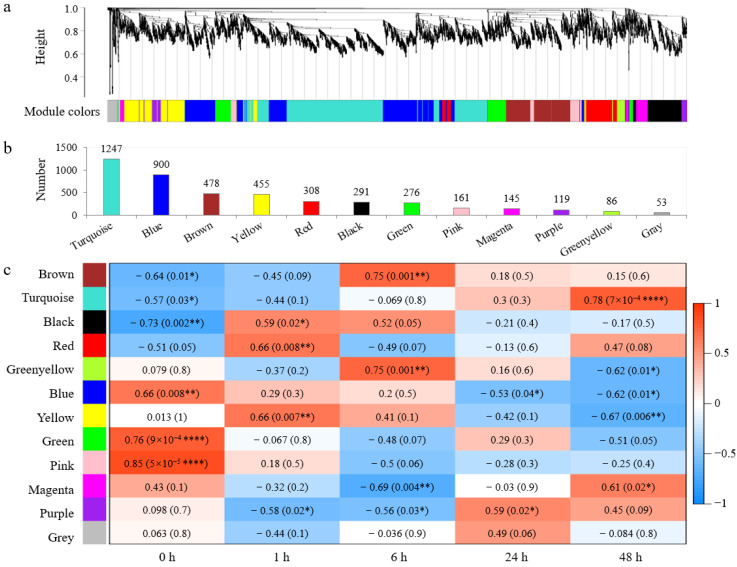
Figure 2.
Weighted gene co-expression network analysis (WGCNA) for DEGs responding to salt stress in wheat leaves. (a) Cluster dendrogram and module colors of 4519 DEGs. (b) The number of DEGs contained in each module. (c) Heatmap for the relationships of modules and salt treatment time-courses. Each cell lists the correlation index and p-value in parentheses; * indicates p < 0.05, ** indicates p < 0.01, and **** indicates p < 0.0001.

