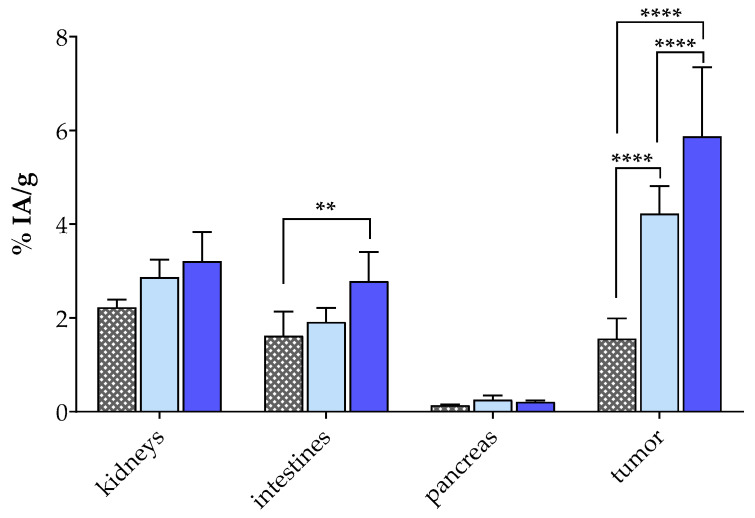
Figure 3.
Selected biodistribution data of [99mTc]Tc-DT11 (average %IA/g ± sd at 4 h pi) in PC-3 xenograft-bearing SCID mice; for comparison purposes, bars from left to right in each set correspond to block (animals co-injected excess NT (100 µg), n = 3; first bar: gray with square filling), controls (second bar: light blue, n = 4) and Entresto® (mice orally receiving Entresto® 30 min before injection of the radioligand, n = 4; third bar: dark blue). Values are shown for kidneys, intestines, pancreases and PC-3 tumors; statistically significant differences are denoted: **, for p < 0.01 and ****, for p < 0.0001.

