Figure 1.
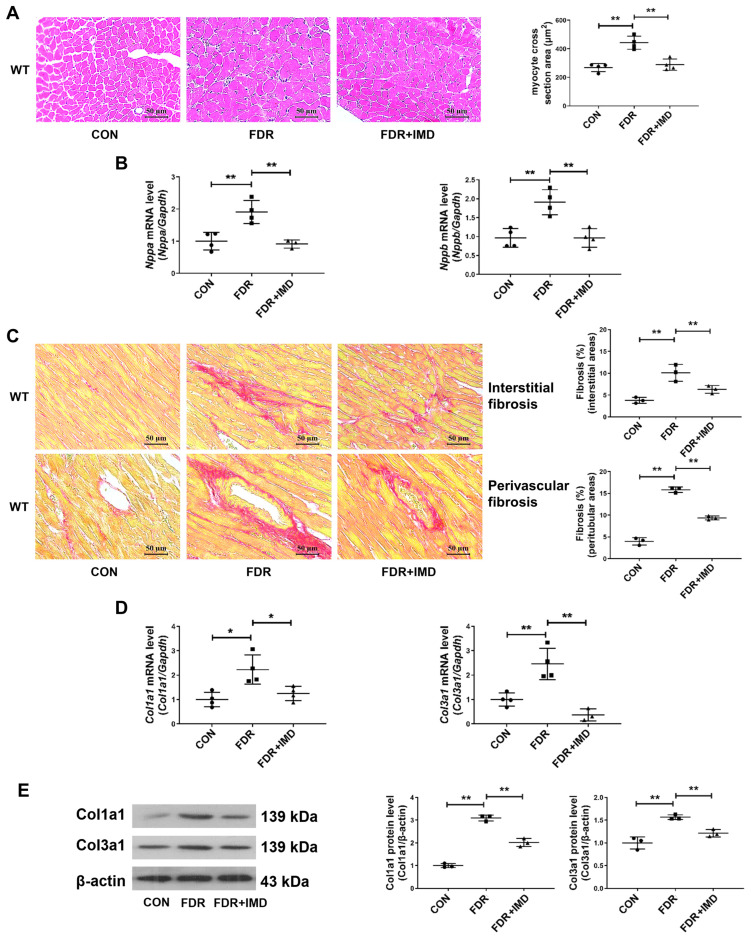
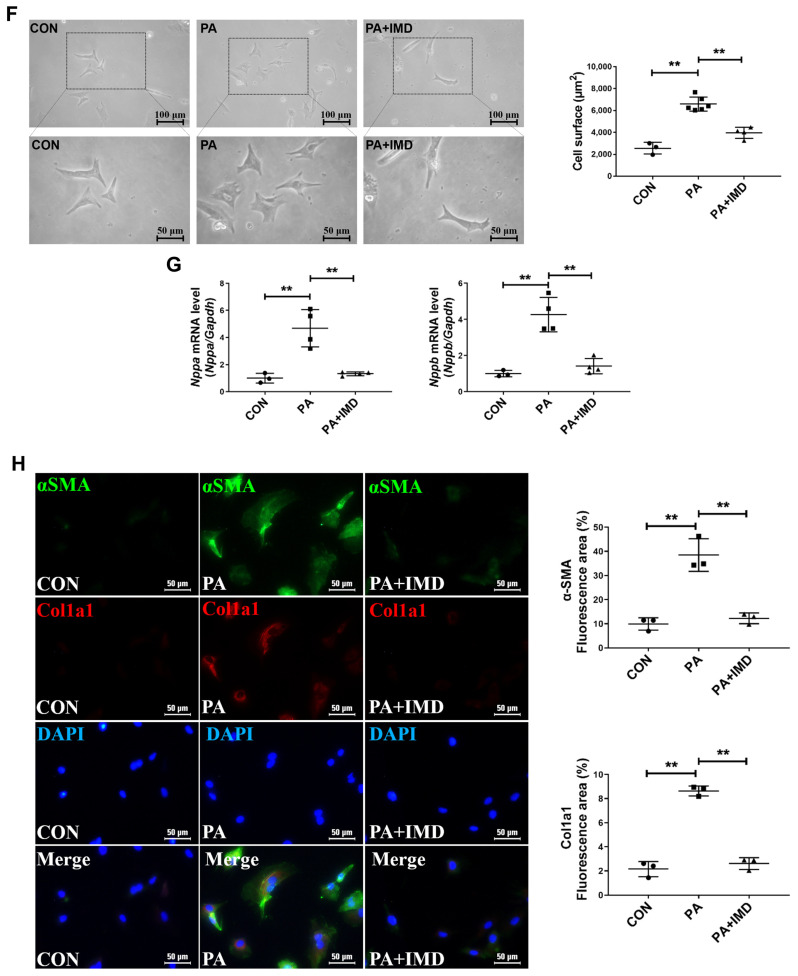
Exogenous IMD alleviates DCM in rats. (A) Hematoxylin–eosin staining of representative heart sections and cardiomyocyte cross-sectional area quantification in rats. Scale bar: 50 μm. n = 4. (B) Quantitative real-time PCR analysis of Nppa and Nppb mRNA expression in the hearts of diabetic rats. n = 3–4. (C) Sirius red staining of myocardial interstitial and perivascular fibrosis area with representative images and quantification in rats. Scale bar: 50 μm. n = 3. (D) Quantitative real-time PCR analysis of Col1a1 and Col3a1 mRNA expression in DCM rat hearts. n = 3–4. (E) Western blot analysis of Col1a1 and Col3a1 protein levels in DCM rat hearts. n = 3. (F) Representative images and quantification of surface (μm2) in NRCMs analyzed by ImageJ 1.53k. Scale bar: 100 μm, 50 μm. n = 3–6. (G) Quantitative real-time PCR analysis of Nppa and Nppb mRNA expression in NRCMs. n = 3–4. (H) Representative images and quantification of immunofluorescence staining for αSMA (green), Col1a1 (red) and DAPI (blue) in primary cultured rat cardiac fibroblasts. Merged images are shown. Scale bar: 50 μm. n = 3. Data are mean ± SD, * p < 0.05, ** p < 0.01.


