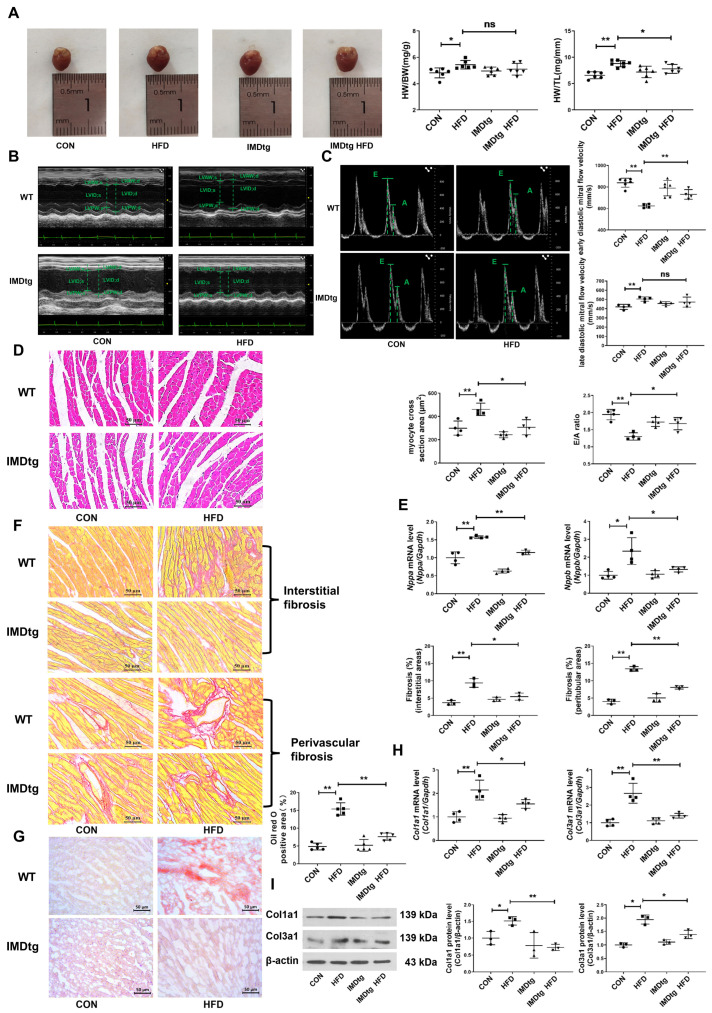
Figure 2.
IMD overexpression alleviates DCM in mice. (A) Representative images of hearts, HW/BW ratio, and HW/TL ratio of diabetic WT and IMDtg mice. Scale bar: 10 mm. n = 6–7. (B) Representative echocardiographic images of diabetic WT and IMDtg mice. (C) Representative pulsed Doppler echocardiography pictures, early diastolic mitral flow velocity (E), late diastolic mitral flow velocity (A), and relative quantification of the mitral E/A ratio of diabetic WT and IMDtg mice. n = 4–6. (D) Hematoxylin–eosin staining of representative heart sections and cardiomyocyte cross-sectional area quantification in mice. Scale bar: 50 μm. n = 4. (E) Quantitative real-time PCR analysis of Nppa and Nppb mRNA expression in the hearts of diabetic WT and IMDtg mice. n = 3–4. (F) Sirius red staining of myocardial interstitial and perivascular fibrosis area with representative images and quantification from different mice. Scale bar: 50 μm. n = 3. (G) Oil Red O staining of myocardial interstitium with representative images and quantification from different mice. Scale bar: 50 μm. n = 5. (H) Quantitative real-time PCR analysis of Col1a1 and Col3a1 mRNA expression in the hearts of diabetic WT and IMDtg mice. n = 4. (I) Western blot analysis of Col1a1 and Col3a1 protein levels in the hearts of diabetic WT and IMDtg mice. n = 3. Data are mean ± SD, * p < 0.05, ** p < 0.01. ns: no significant difference.

