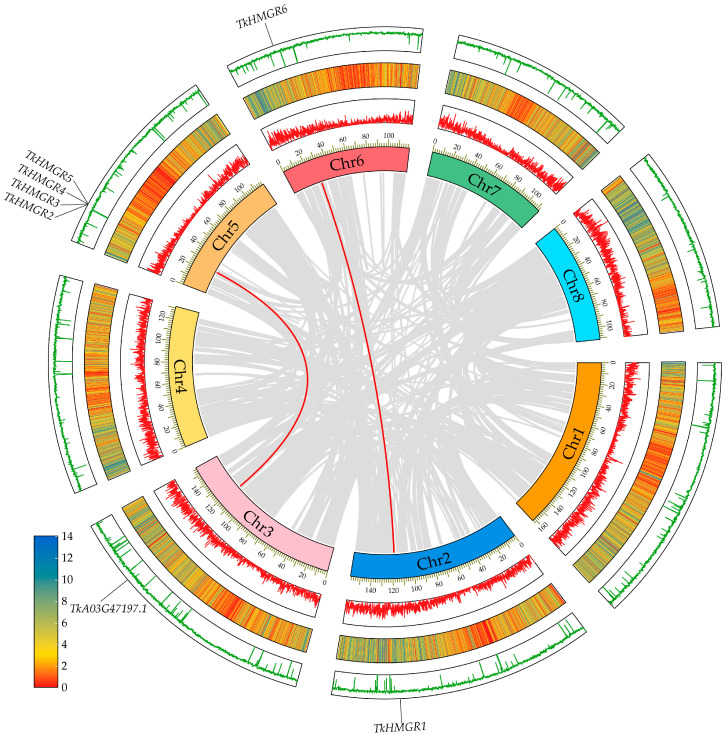
Figure 4.
Collinearity analysis of TkHMGR genes. The red lines show the TkHMGR gene pairs replicated; the grey lines indicate collinear blocks across the whole genome. The innermost track of the Circos plot indicates the chromosome length and number. The second and third tracks indicate the density of genes on the corresponding chromosome; the gene density distribution of the TKS genome varies from 0 to 14, with an average of 4 genes per 100 kb. The outermost track represents the corresponding GC content of the whole genome.

