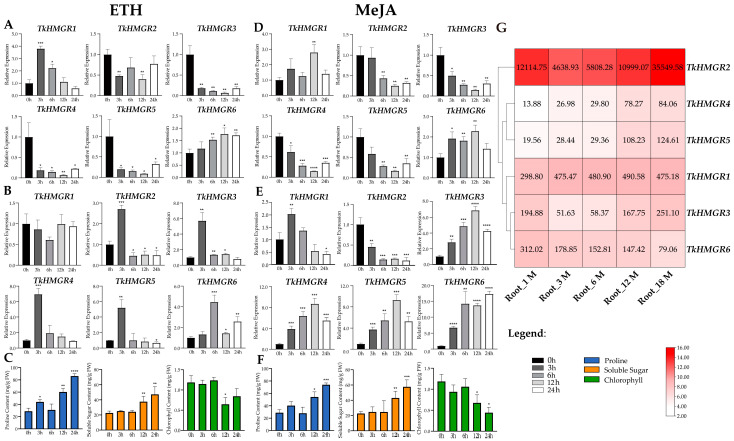
Figure 7.
Expression profiles of TkHMGR genes and the changes in proline, soluble sugar, and chlorophyll content under exogenous hormone treatment. (A) Expression levels in roots of six-month-old TKS treated with 100 μmol/L ETH. (B) Expression levels in leaves of six-month-old TKS treated with 100 μmol/L ETH. (C) Proline and soluble sugar content in 6-month-old TKS roots treated with ETH; chlorophyll content in 6-month-old TKS leaves treated with ETH. (D) Expression levels in roots of six-month-old TKS treated with 1 mmol/L MeJA. (E) Expression levels in leaves of six-month-old TKS treated with 1 mmol/L MeJA. (F) Proline and soluble sugar content in 6-month-old TKS roots treated with MeJA; chlorophyll content in 6-month-old TKS leaves treated with MeJA. Data are shown as the means ± SD of three independent biological repetitions using the 2−ΔΔCt method with Tkβ-actin as the internal standard for normalization. Asterisks represent significant differences via the Student’s t-test analysis compared with the control (* p < 0.05, ** p < 0.01, *** p < 0.001, and **** p < 0.0001). (G) The heatmap display of TKS roots from different developmental stages: 1 month old, 3 months old, 6 months old, 12 months old, and 18 months old based on transcript per million (TPM) values. Red indicates high expression levels, and white indicates low expression levels. The numbers on the box represent the TPM value.

