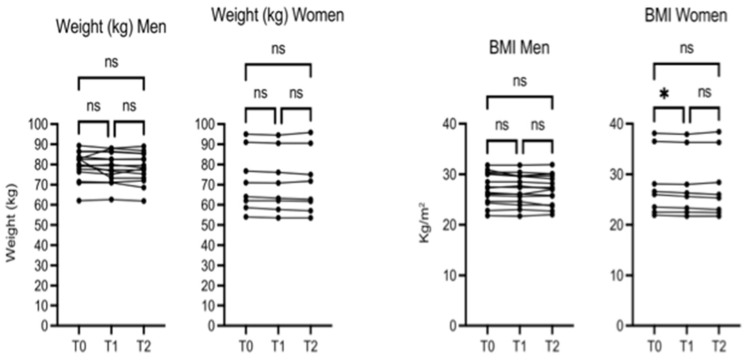
Figure 2.
OMWW-OL consumption effects on weight and BMI in volunteers. The images show the single values at T0, T1, and T2. There were no differences in the men’s weight and BMI values; in the women, the BMI showed a slight decrease at 30 days (T1), returning to the value of T0 after 60 days (T2). The Y-axis reports the values of the analyzed biomarker. Statistics are performed in comparison between the average of T0/T1 ± SEM, T1/T2 ± SEM, T0/T2 ± SEM. * p < 0.05, ns: non-significant.

