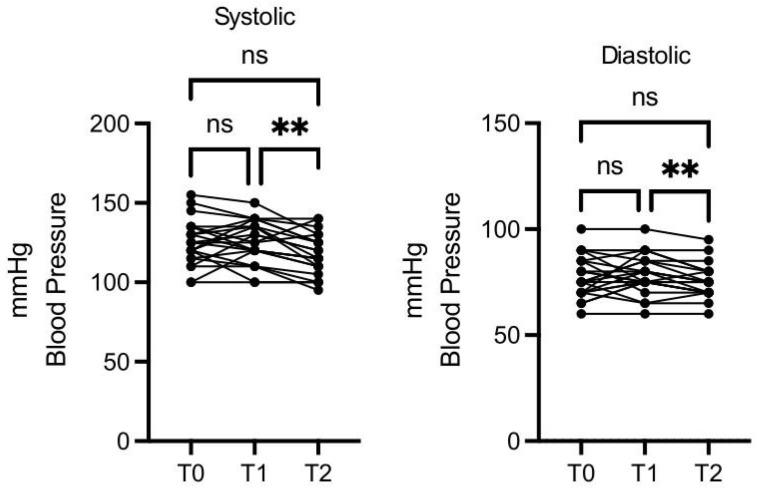
Figure 4.
OMWW-OL consumption effects on blood pressure in volunteers. The images show the single values at T0, T1, and T2. Blood pressure values decreased significantly at T2 vs. T1, both in the maximum and minimum values. The Y-axis reports the values of the analyzed biomarker. Statistics are performed in comparison between the average of T0/T1 ± SEM, T1/T2 ± SEM, T0/T2 ± SEM. ** p < 0.01, ns: non-significant.

