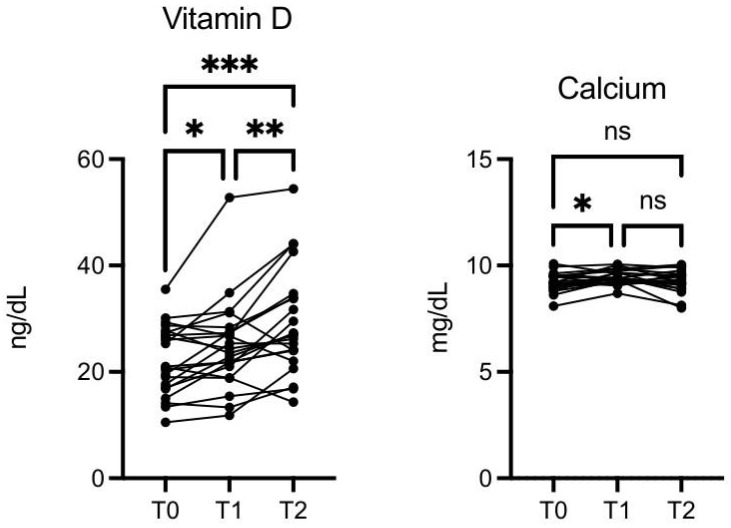
Figure 7.
OMWW-OL consumption effects on vitamin D and calcium in volunteers. The images show the single values at T0, T1, and T2. Vitamin D increases following OMWW intake in a statistically significant manner both at T1 and T2. Calcium was increased at T1 vs. T0. The Y-axis reports the values of the analyzed biomarker. Statistics are performed in comparison between the average of T0/T1 ± SEM, T1/T2 ± SEM T0/T2 ± SEM. * p < 0.05, ** p < 0.01, *** p < 0.001, ns: non-significant.

