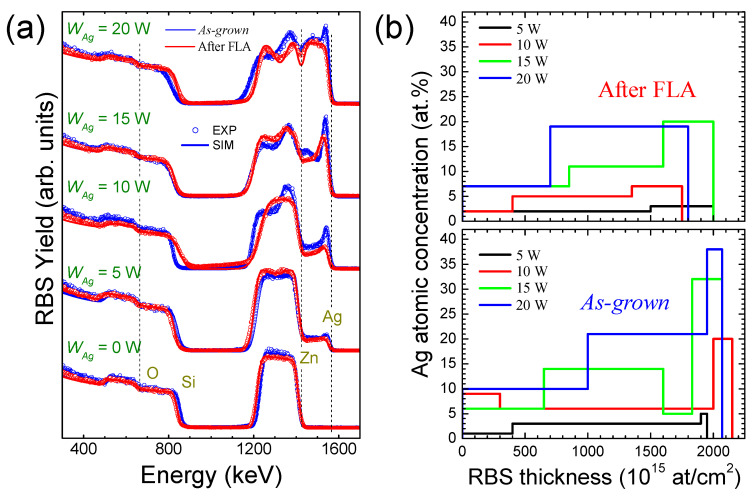
Figure 1.
(a) RBS spectra of as-grown (blue) and after FLA (red) SZO films produced with different WAgs. The experimental (dots) and simulated (solid lines) curves are shown for the as-grown samples. (b) Ag in-depth profiles extracted from the simulation of the RBS spectra for as-grown (bottom) and after FLA (top) samples.

