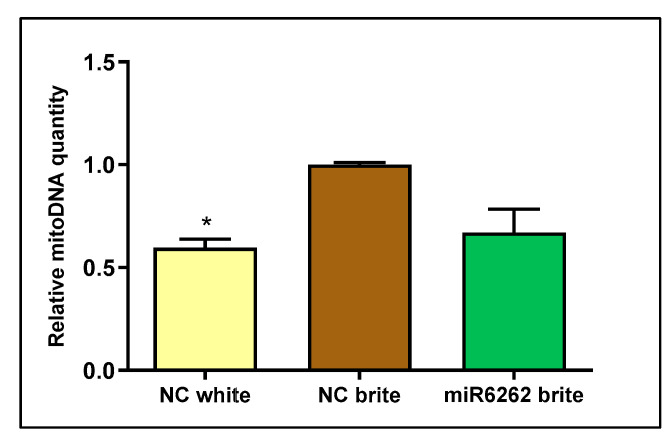
Figure 6.
Mitochondrial DNA quantification in hMADS cells differentiated into brite and white adipocytes and plant miR6262 mimic transfected brite adipocytes. Transfection of hMADS cells was performed with 25 nM of the plant miR6262 mirVana mimic (5′-UCUUUAGAAAGUUAGAAUUGU-3′) and a negative control (a scramble sequence) at day 10–12 of differentiation. Stimulation of the conversion of white adipocytes in brite adipocytes (browning process) was conducted between days 14 and 18 of differentiation. DNA expression levels were analyzed in white and brite adipocytes by qPCR. Cq values of the mitochondrial gene NADHdS1 were normalized to the nuclear gene LPL and expressed as relative mitochondrial DNA levels calculated by the 2−ΔΔCt method. Results are expressed as mitochondrial DNA levels relative to brite negative control ± standard error of the mean (SEM) (n = 2). p-value: * p < 0.05. Abbreviations: NC (negative control), mitoDNA (mitochondrial DNA).

