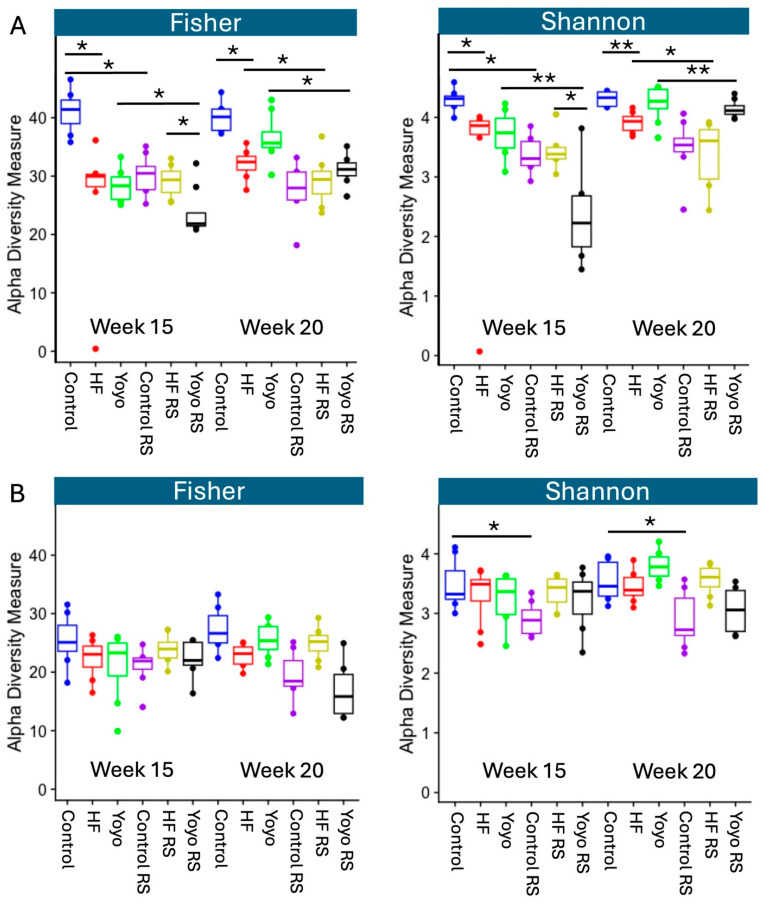
Figure 9.
Alpha diversity. Fisher’s and Shannon’s diversity indices of faecal samples of male (A) and female mice (B) in week 15 and week 20. The median is illustrated by the horizontal line inside the box. The lowest and highest values within 1.5 times the interquartile range from the 1st and 3rd quartiles, respectively, are illustrated by whiskers. * p ≤ 0.05, ** p ≤ 0.01, with n = 6–8/group/sex. Boxes represent the interquartile range between the first and third quartiles. The horizontal line inside the box illustrates the median. Solid dots (●) outside the whiskers indicate greater than 1.5 times and less than 3 times the interquartile range. Graphs were generated from raw and untrimmed data. HF—high-fat diet; RS—resistant starch.

