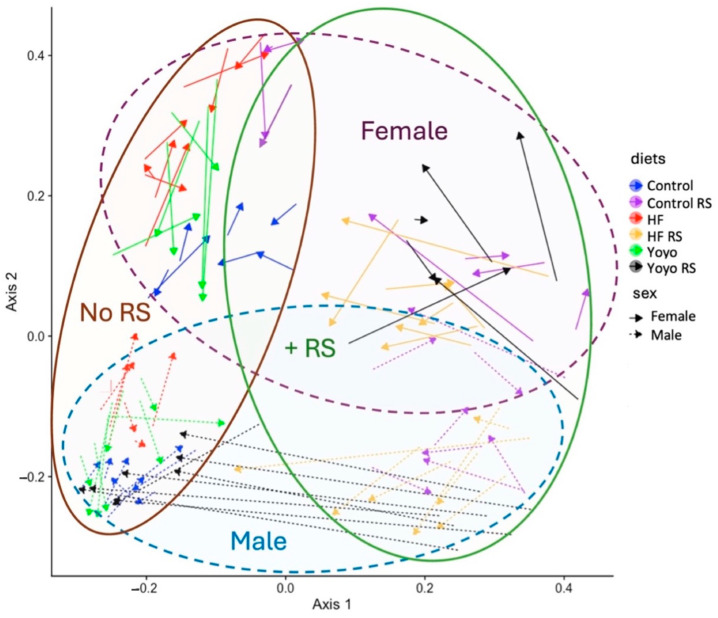
Figure 10.
Principal coordinate analysis (PCoA)—beta diversity. Bray–Curtis ordination plot showing the dissimilarity of the gut microbiota from mice fed six different diets at two time points (weeks 15 and 20). The microbiota profiles of different dietary treatments are represented by different colours: blue (control), purple (control RS), red (HF), yellow (HF RS), green (yoyo), and black (yoyo RS). Solid arrows represent female mice, and arrows with dashed lines represent male mice. The tail of an arrow indicates microbiota composition in week 15, while the tip of an arrow indicates microbiota composition in week 20. RS—resistant starch; HF—high fat.

