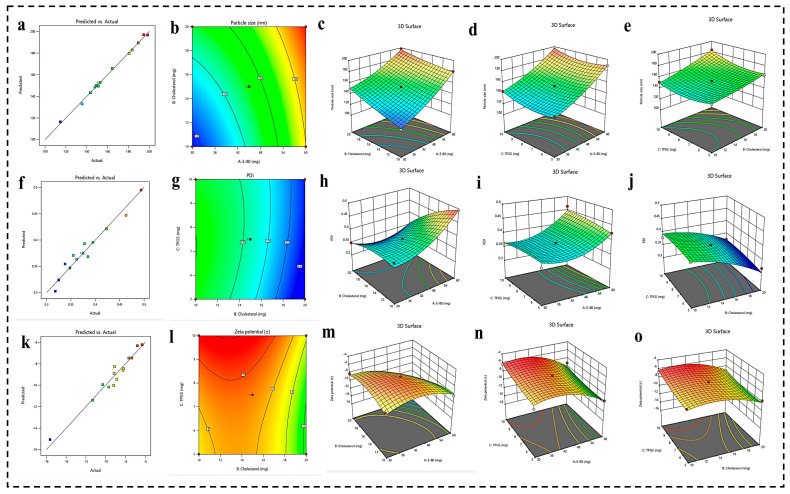
Figure 1.
(a–e) Prediction versus actual graph, 2D contour plot, and 3D response surface graph representing the impact of different independent variables (E-80, cholesterol, and TPGS) on PS. (f–j) Prediction versus actual graph, 2D contour plot, and 3D response surface graph representing the impact of different independent variables (E-80, cholesterol, and TPGS) on PDI. (k–o) Prediction versus actual graph, 2D contour plot, and 3D response surface graph representing the impact of different independent variables (E-80, cholesterol, and TPGS) on ZP.

