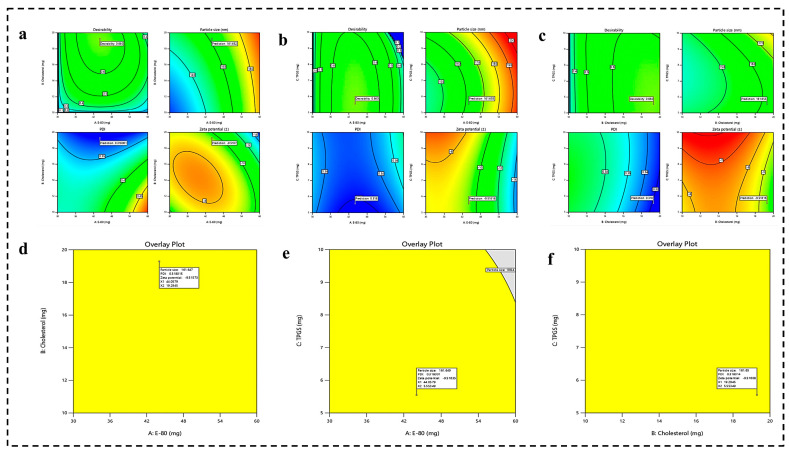
Figure 2.
(a–c) The desirability graph representing the effect of independent (E-80, cholesterol, and TPGS) on dependent variables (PS, PDI, and ZP) and predicting the actual responses for PS, PDI, and ZP at desired level of independent variables. (d–f) Optimization of dependent variables (PS, PDI, and ZP) using overlay plot.

