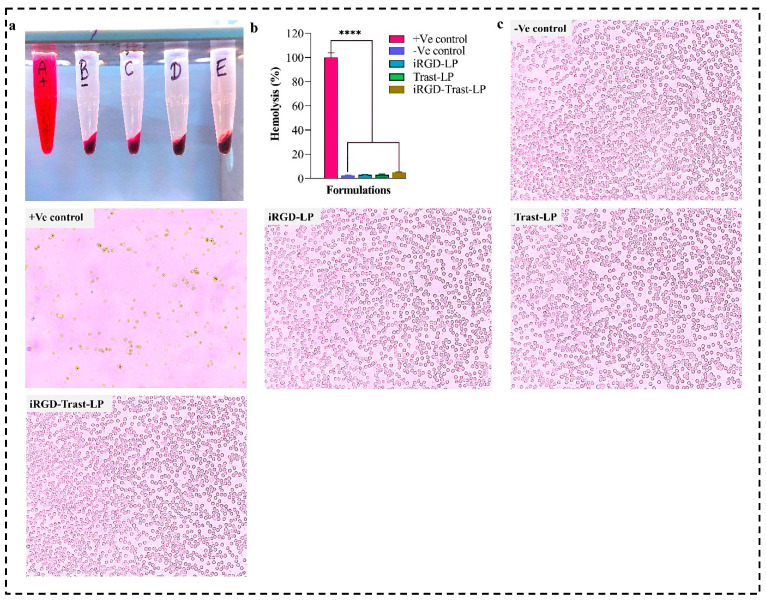
Figure 8.
(a) Hemolysis assay of +Ve control (A), -Ve control (B), iRGD-LP (C), Trast-LP (D), and iRGD-Trast-LP (E). (b) Graph representing the % hemolysis of all the groups. (c) Microscopic images of RBCs of SDL and DSDL groups after hemolysis. The images were captured at 20× magnification. All the data represented as mean ± SD, (n = 3). p < 0.0001, denoted by **** and indicates highly significant data.

