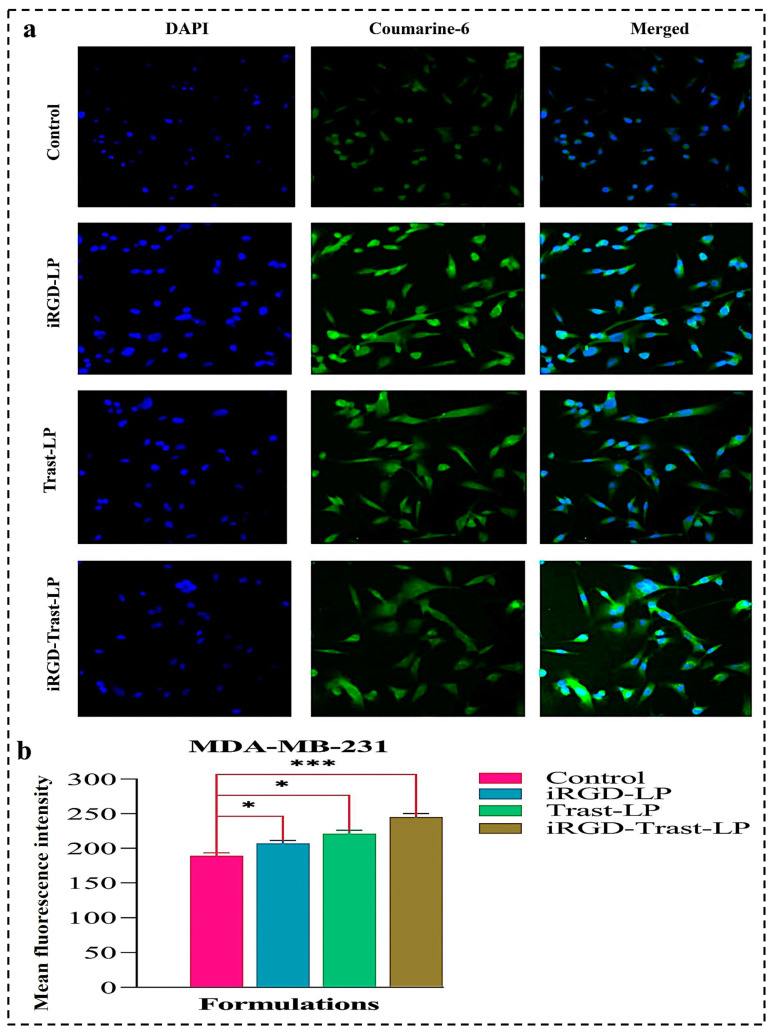
Figure 11.
(a) Cellular uptake of control, iRGD-LP, Trast-LP, and iRGD-Trast-LP on MDA-MB-231 cells. All the images were photographed at a magnification of 20×. (b) Quantification of cellular internalization was performed by measuring mean MFI value using ImageJ software version 1.54g. All data are presented as mean ± SD with n = 3. * denotes p < 0.05, considered significant; and *** denote p < 0.001 considered highly significant data.

