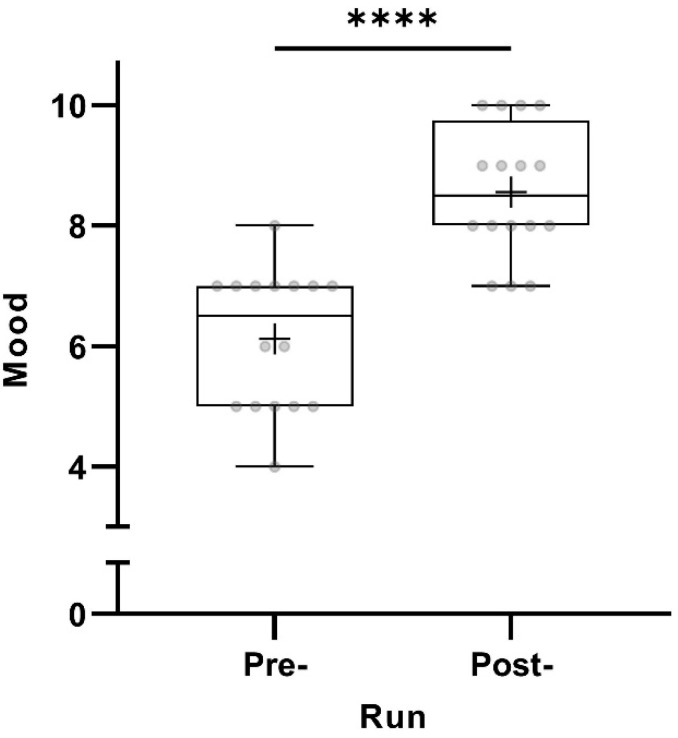
Figure 1.
Pre- and post-run mood (in points from 0 to 10) taking all participants into account (n = 16). The horizontal lines in the box depict the median value; the upper and lower horizontal lines represent the interquartile range from quartile 1 to quartile 3; whiskers indicate minimum and maximum values; circles indicate individual values; the overall mean value is indicated by +; **** p < 0.0001.

