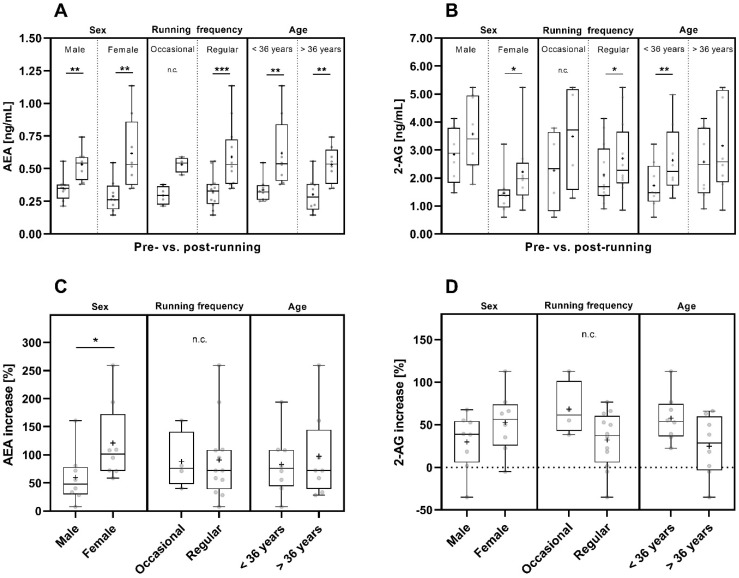
Figure 4.
Pre- and post-run AEA (A) and 2-AG (B) concentrations and their pre- to post-run concentration increases (percent increase compared to pre-run concentrations) (C,D) considering sex [male (n = 8) and female (n = 8)], running frequency [occasional (n = 4) and regular runners (n = 12)] and age [<36 years (n = 8) and >36 years (n = 8)]. The horizontal line that splits the box into two parts depicts the median value; the upper and lower horizontal lines represent the interquartile range from quartile 1 to quartile 3; minimum and maximum values are marked by whiskers; the mean value is indicated by +; *: p < 0.05; **: p < 0.01; ***: p < 0.001; n.c.: not computed.

