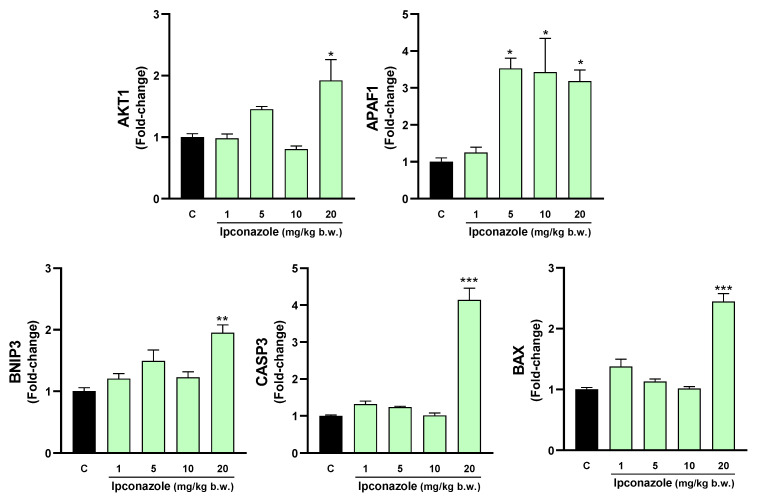
Figure 6.
Real-time molecular expression of cell death biomarkers (AKT1, APAF1, BNIP3, CASP3 and BAX) in the rat striatum. Results are presented as mean ± SEM of four replicates per treatment. The significance between the treatments (green bars) and the control group (black bar) was determined by one-way ANOVA using Tukey’s post hoc test. * p ≤ 0.05, ** p ≤ 0.01 and *** p ≤ 0.001 indicate the significance between the treatments versus the control group.

