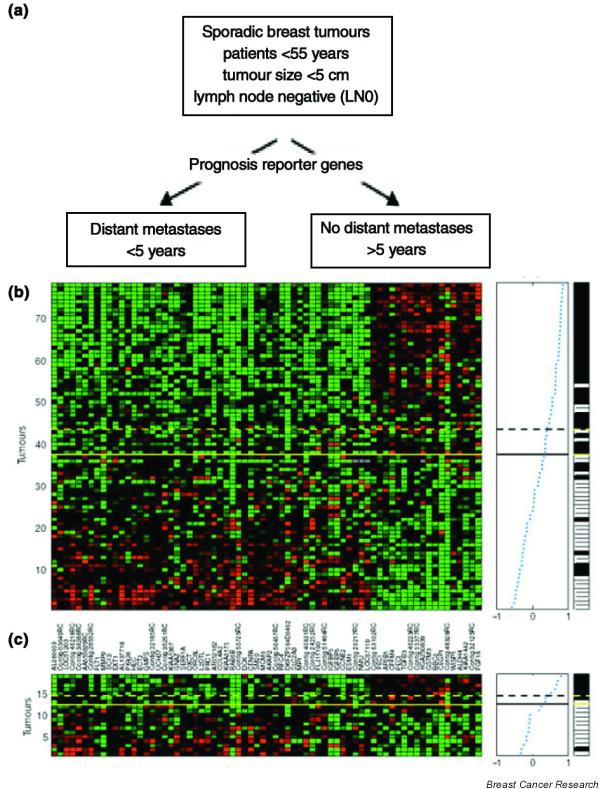
Figure 1.

Supervised classification on prognosis signatures (van 't Veer). The 78 tumors are listed vertically, and the 70 'prognostic' genes horizontally. The expression levels are shown in red (expression levels above the mean for the gene) and green (levels below the mean for the gene).
