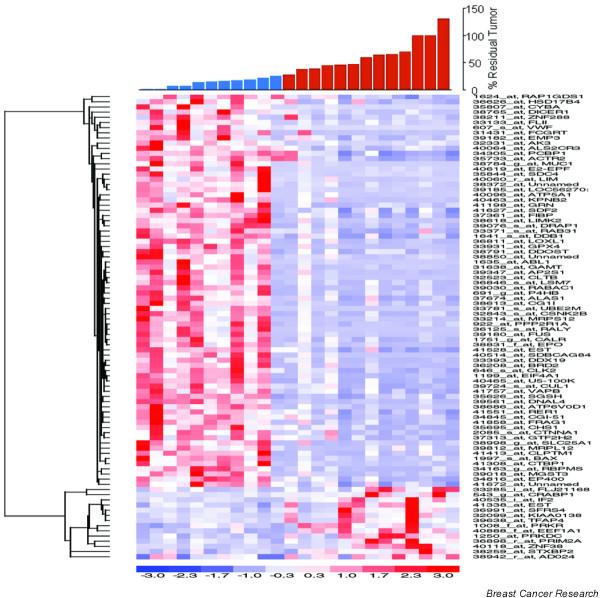
Figure 2.

Hierarchical clustering of genes correlated with response to docetaxel. Sensitive tumors (S) are defined as those with 25% residual disease or less (shown as blue bars), and resistant tumors (R) are defined as those with greater than 25% residual disease (shown as red bars). The expression levels are shown in red (expression levels above the mean for the gene) and blue (levels below the mean for the gene).
