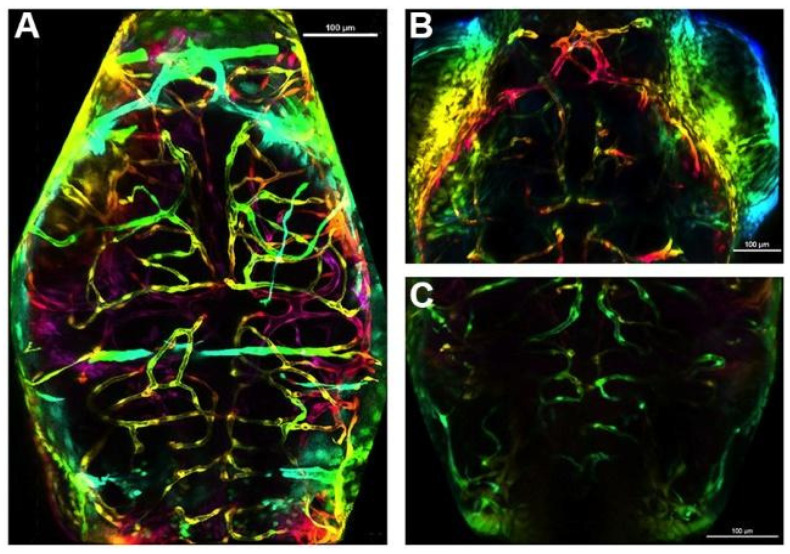
Figure 4.
Examples of decreases observed in the mesencephalon (midbrain) and cerebellum (hindbrain) vasculature at 72 hpf. A representative brain of a fish in the control treatment group (A), of the mesencephalon of a fish in the 100 ppb As treatment group (B), and of the cerebellum of a fish in the 10 ppb Pb treatment group (C). Scale bar is 100 µM.

