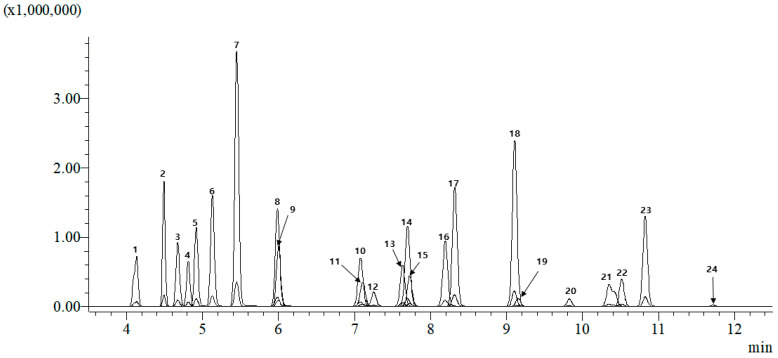
Figure 1.
Total ion chromatogram (TIC) of a 100 ng/g mixture of 24 pesticides in solvent. The chromatogram displays the separation of 24 pesticide compounds in a solvent using LC–MS/MS, demonstrating their distinct retention times and ionization profiles. The numbers of the peaks correspond to the sequence listed in Table 1.

